Smartsheet Is Getting More Expensive: What the Pricing Trend Means for Those Switching
Smartsheet's prices have risen sharply over the years. What matters when it comes to total cost of ownership and why Merlin Project is a calm alternative.
Guides, product news and voices from practice, so your projects succeed.
Curated articles and hands-on guides for project management
News, tips and insights from the world of project management
Microsoft Project Online will be discontinued on September 30, 2026. What is ending, where Microsoft points users and what a native Mac alternative looks like.
Read more →Smartsheet's prices have risen sharply over the years. What matters when it comes to total cost of ownership and why Merlin Project is a calm alternative.
Our website is new: fresh design, a faster site, search via Command K, and prices and features bundled in one place.
How Amann Architektur from Schaan runs a Swiss hospital new-build in active operation with Merlin Project. A testimonial about 1,500 tasks in a single file.
Project Management Best Practices: Kathrin Lamm talks about her very own mix of methods for project success.
A closer look at the people and the reasons behind the scenes at Merlin Project Support, with a focus on consistency.
Project management for architects: phase frameworks (RIBA, AIA, HOAI), core methods (Gantt, WBS, Kanban) and tools for truly predictable building projects.
You want to transfer your data from an MS Project file to to Merlin Project? Here essential information for you.
Changed to a another Mac? With Merlin Project you have an easy way to transfer your license. A step-by-step guide.
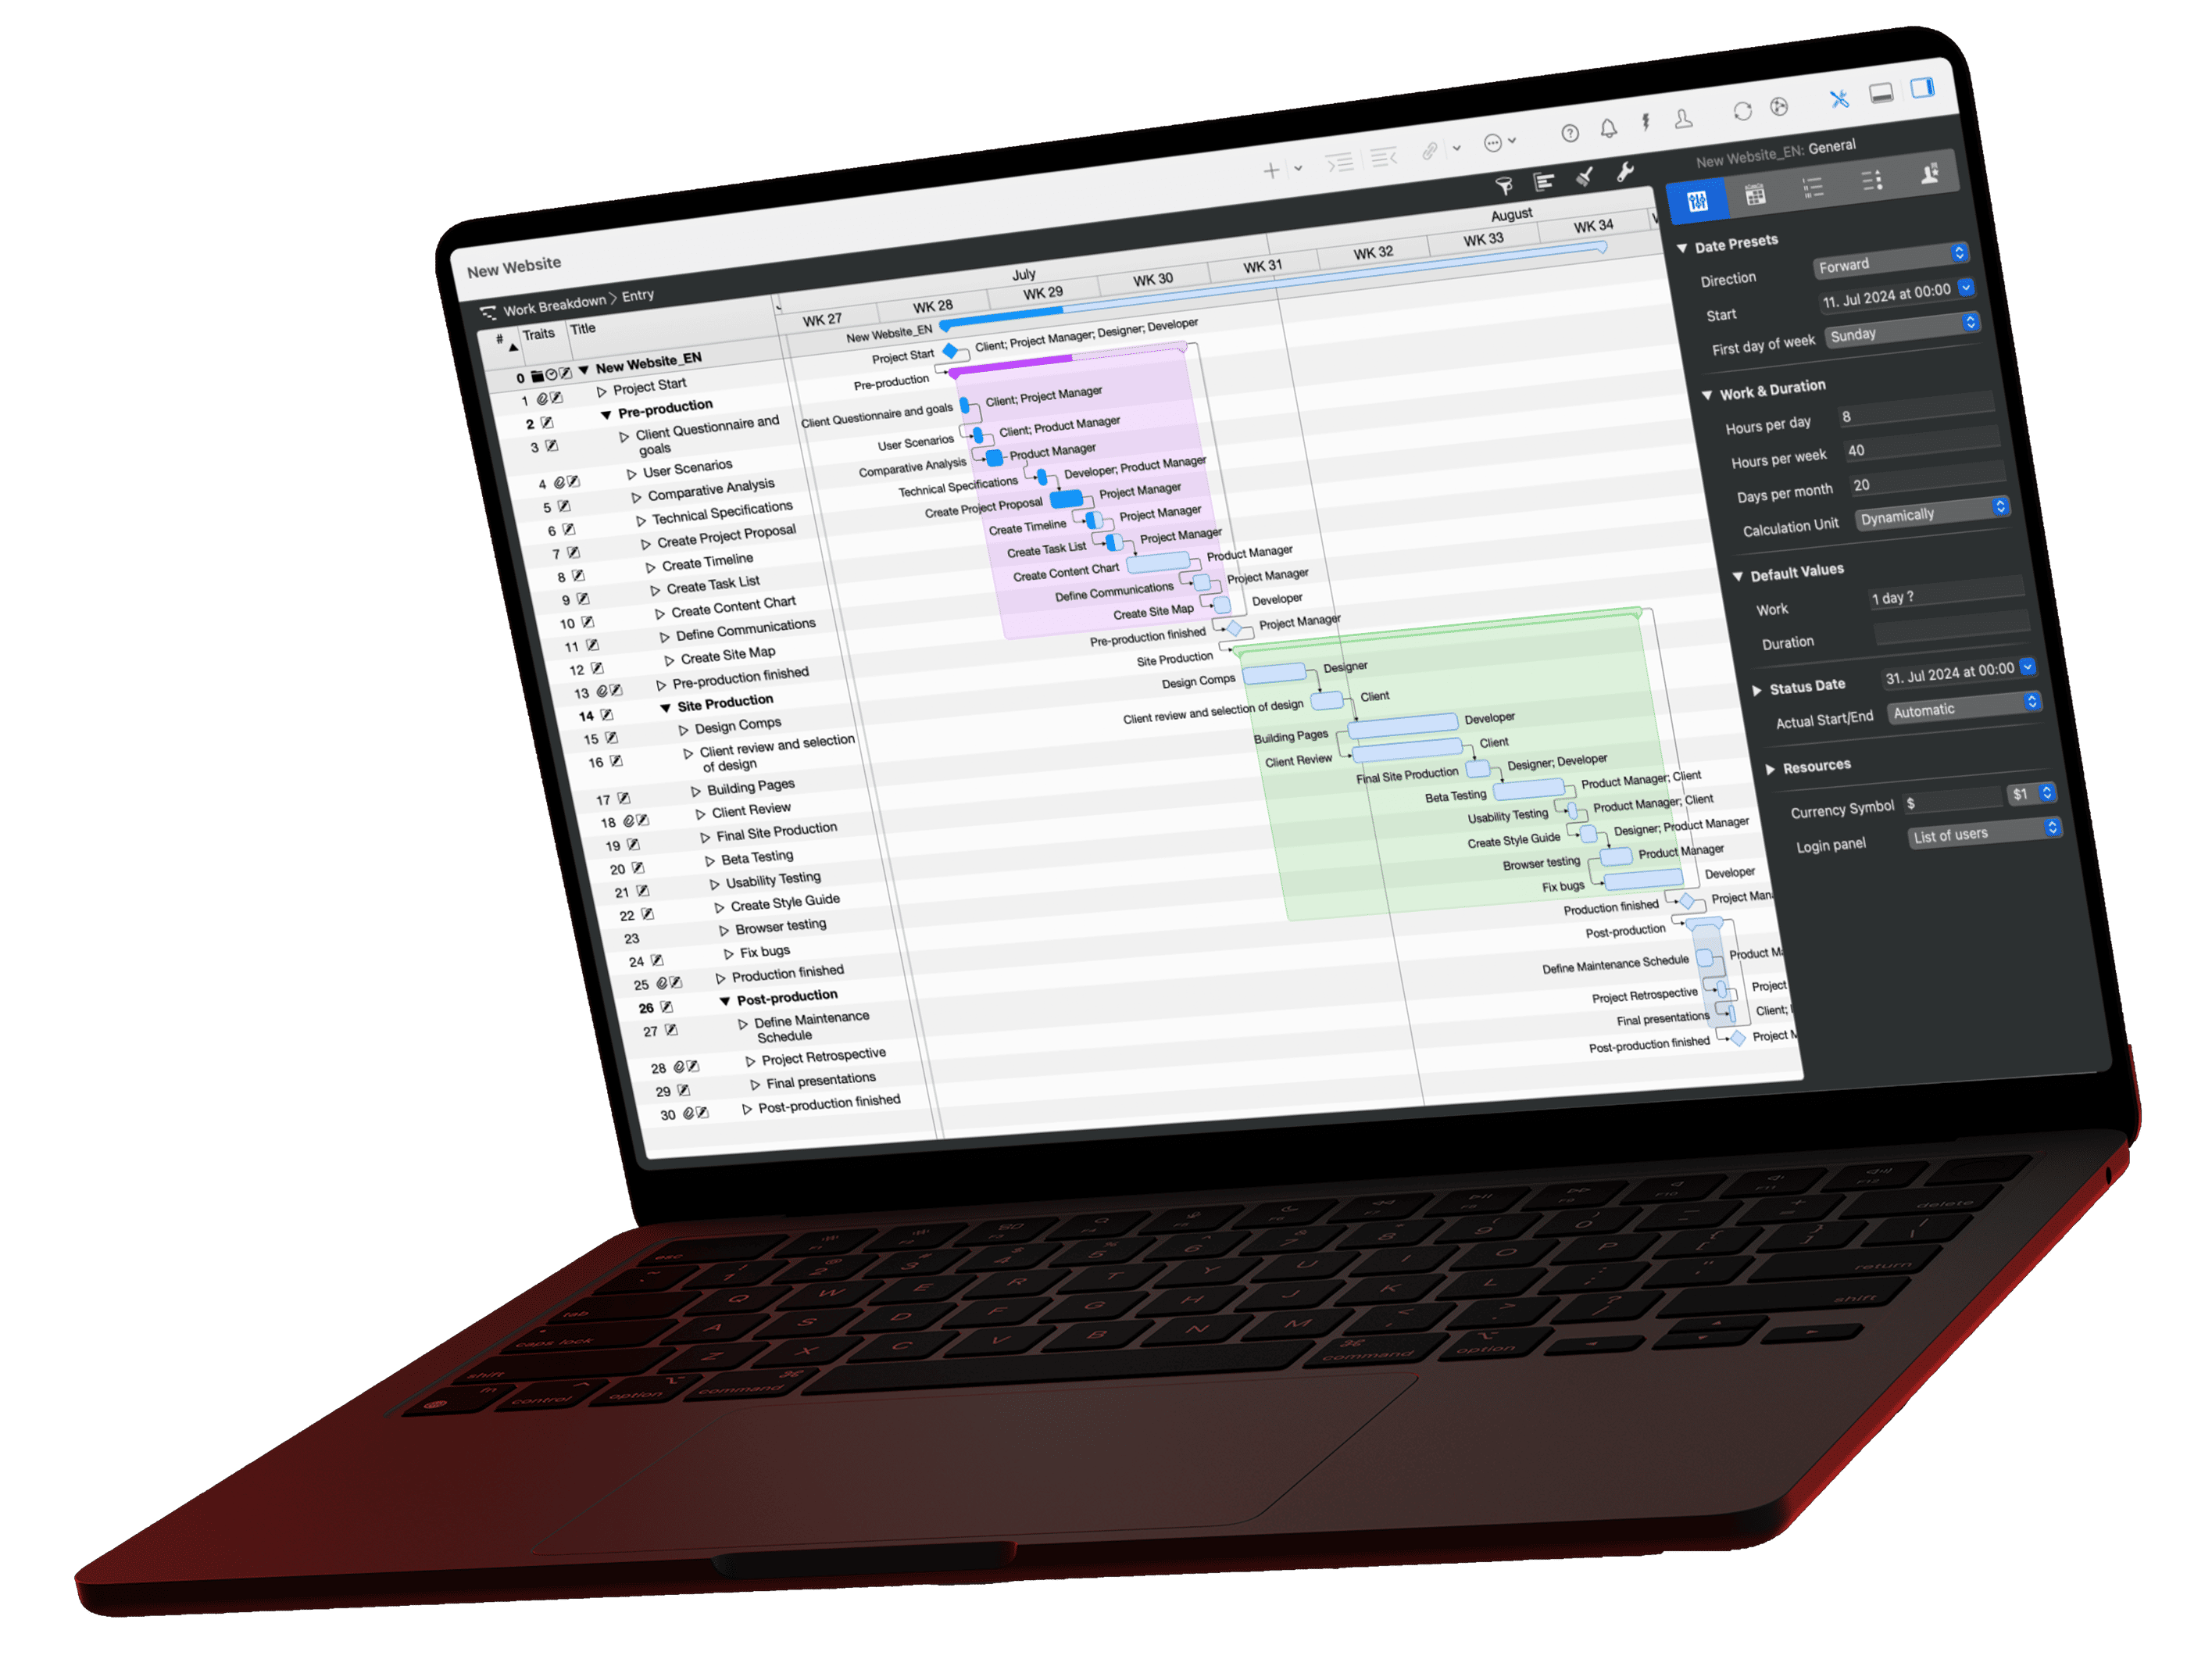
One app for your project plan, native on every Apple device.