Blog

The Ultimate Guide to PERT Charts

PERT Chart: The Definite Guide for Project Managers

PERT charts are a basic project management tool to organize, schedule and coordinate project activities. Learn the advantages and disadvantages of this method.

Table of Contents
What Is a PERT Chart?
Advantages and Disadvantages of a PERT Chart
The Core PERT Methodology: Time Calculation
How to Create a PERT Chart Step-by-Step
When to Use a PERT Chart vs. Other Tools
Example: Calculating a Task’s Duration with PERT
Practical Tips
Conclusion

What Is a PERT Chart?

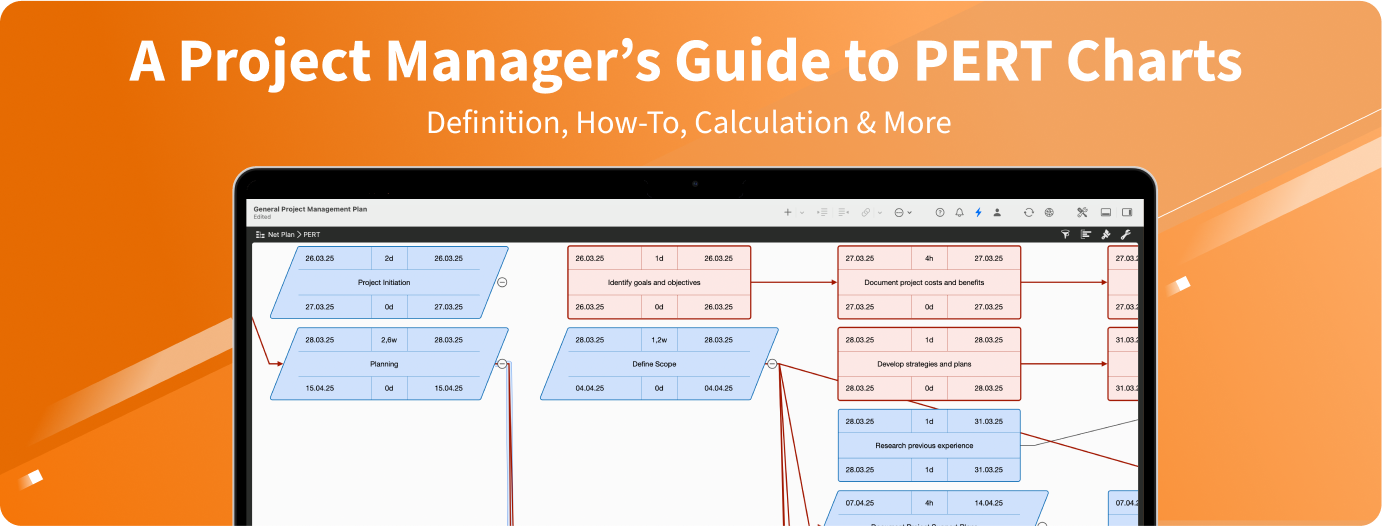
A PERT chart (Program Evaluation and Review Technique) is a project management tool designed to visualize the activities in a project, their logical dependencies, and their chronological sequence. It goes beyond the work breakdown structure (WBS) by highlighting not only relationships among tasks but also the sequence in which they should be carried out. This helps project managers identify the critical path (i.e., the sequence of tasks that directly affects the total project duration) and any time buffers (slack).

Why Use a PERT Chart?

  • Comprehensive Overview: It forces you to think through the entire project, making hidden or unclear tasks visible.
  • Logical and Chronological Structure: It emphasizes the order and dependencies of tasks, which can be critical for more complex or longer-running projects.
  • Critical Path Identification: It shows where the tightest constraints lie and which tasks must be closely monitored to prevent delays.
  • Time Estimation: By examining earliest start and latest finish times, you can plan more accurately and potentially reduce costs.
  • Clear Communication Tool: It offers an easy-to-understand, visual representation of a project’s flow, making it helpful in stakeholder communication.

Tip: Explore the Merlin Project Learning Path for more Project Management Tips & Tricks

Showcase Your Projects in the Best Light With Our Dedicated PERT View
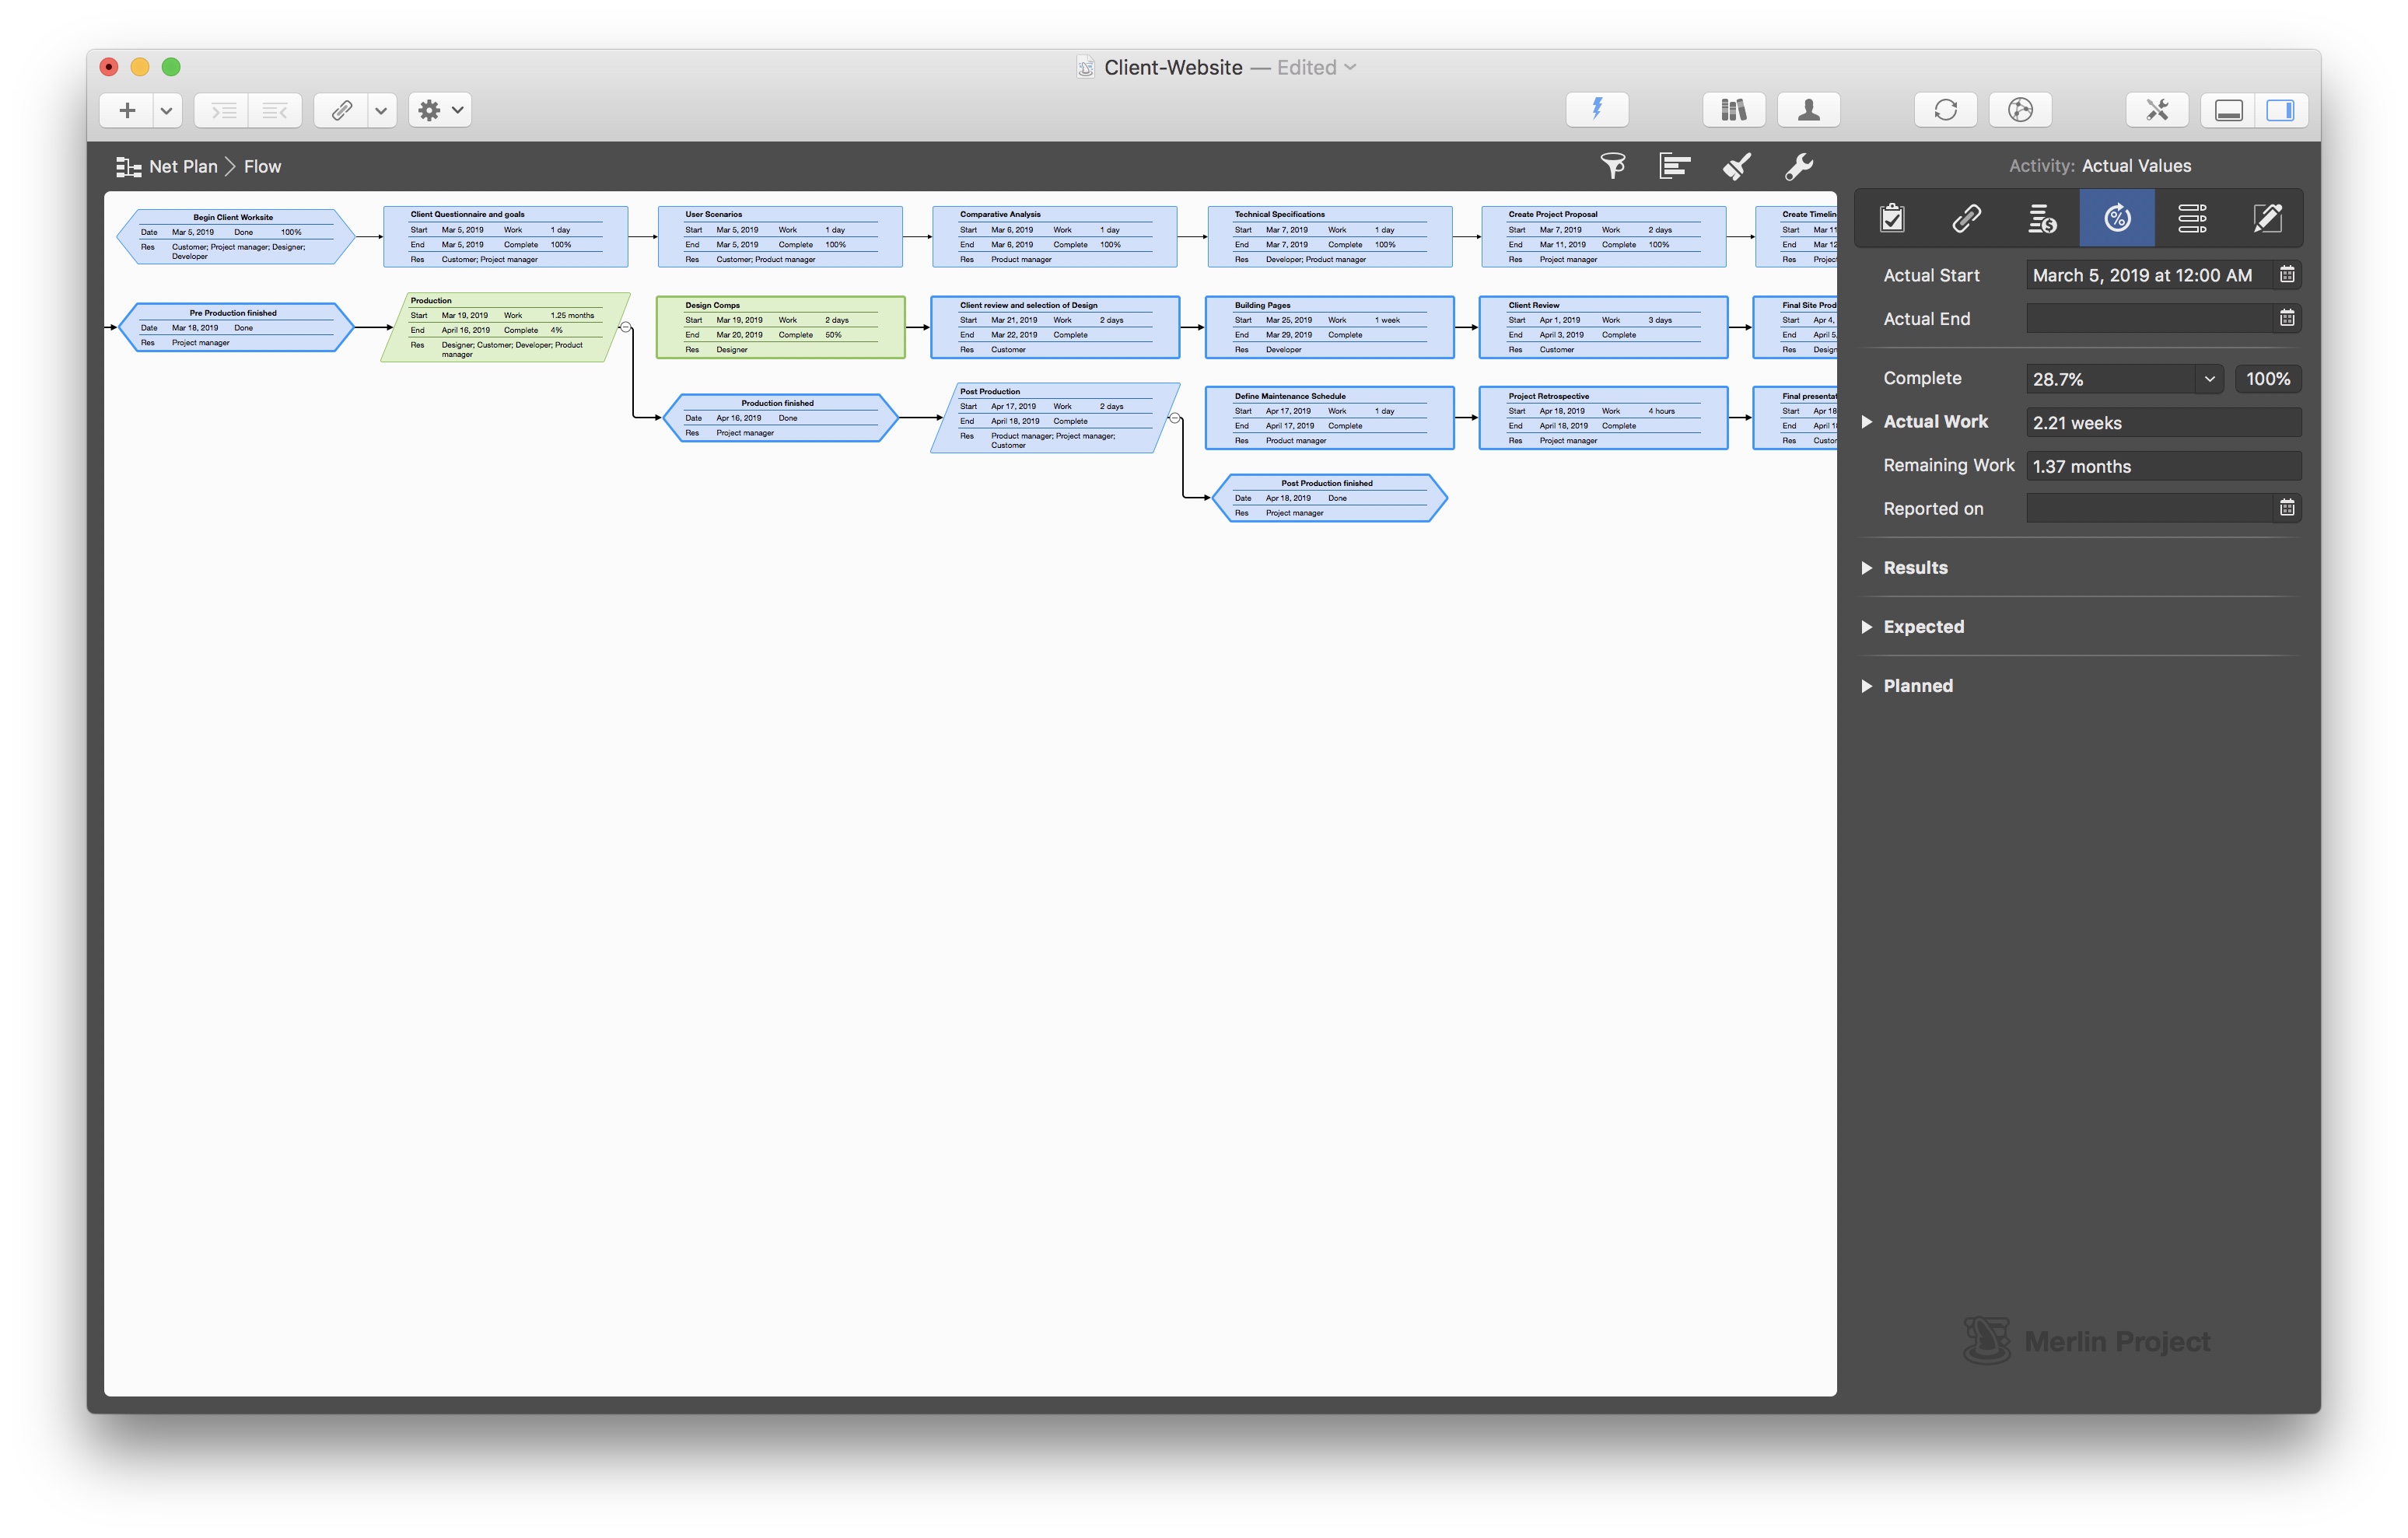
Ready to visualize your net plan quickly and precisely? Explore Merlin Project, which offers a special PERT Charts project view. Gain clarity on task dependencies, critical paths, and time buffers, all in one intuitive workspace. Try it free for 30 days!

Advantages and Disadvantages of a PERT Chart

Advantages Disadvantages
The preparation makes it necessary to think through the entire project and not just individual sub-areas. In this way, open points become visible. The creation is relatively complex.
The network plan creates a meaningful overview of all project activities and their mutual dependencies. The presentation requires training in order to fully capture the information content.
The plan can be easily updated. The more detailed the network, the higher the control effort to avoid planning errors.
A relatively exact scheduling and thus cost saving is possible. The method is oversized for small projects.
Bottlenecks (critical path and buffer) are easy to recognize.
The network can be developed independently of schedule assumptions.
The plan is a clear communication tool for the project managers.

Tip: Net plan technology (including PERT charts) is most beneficial for larger or complex projects. For simpler or shorter efforts, you may find agile PM methods with Kanban boards or Gantt charts more intuitive and less time-consuming to set up.


The Core PERT Methodology: Time Calculation

A defining feature of the PERT method is its approach to time estimation for tasks. Instead of a single guess, PERT uses three estimates to capture uncertainty:

  1. Optimistic (O): Best-case scenario where everything goes smoothly.
  2. Most Likely (M): The most realistic expectation under normal working conditions.
  3. Pessimistic (P): Worst-case scenario where complications and delays occur.

Using these three estimates, PERT calculates an expected duration (TE) for each activity, typically using the formula:

TE = (O + 4M + P) / 6

You can also calculate the variance or standard deviation for each task to assess the probability of finishing on time, although many modern project management applications (like Merlin Project) handle these calculations automatically.


How to Create a PERT Chart Step-by-Step

Even though many project management tools automate most steps, it’s essential to understand the underlying process:
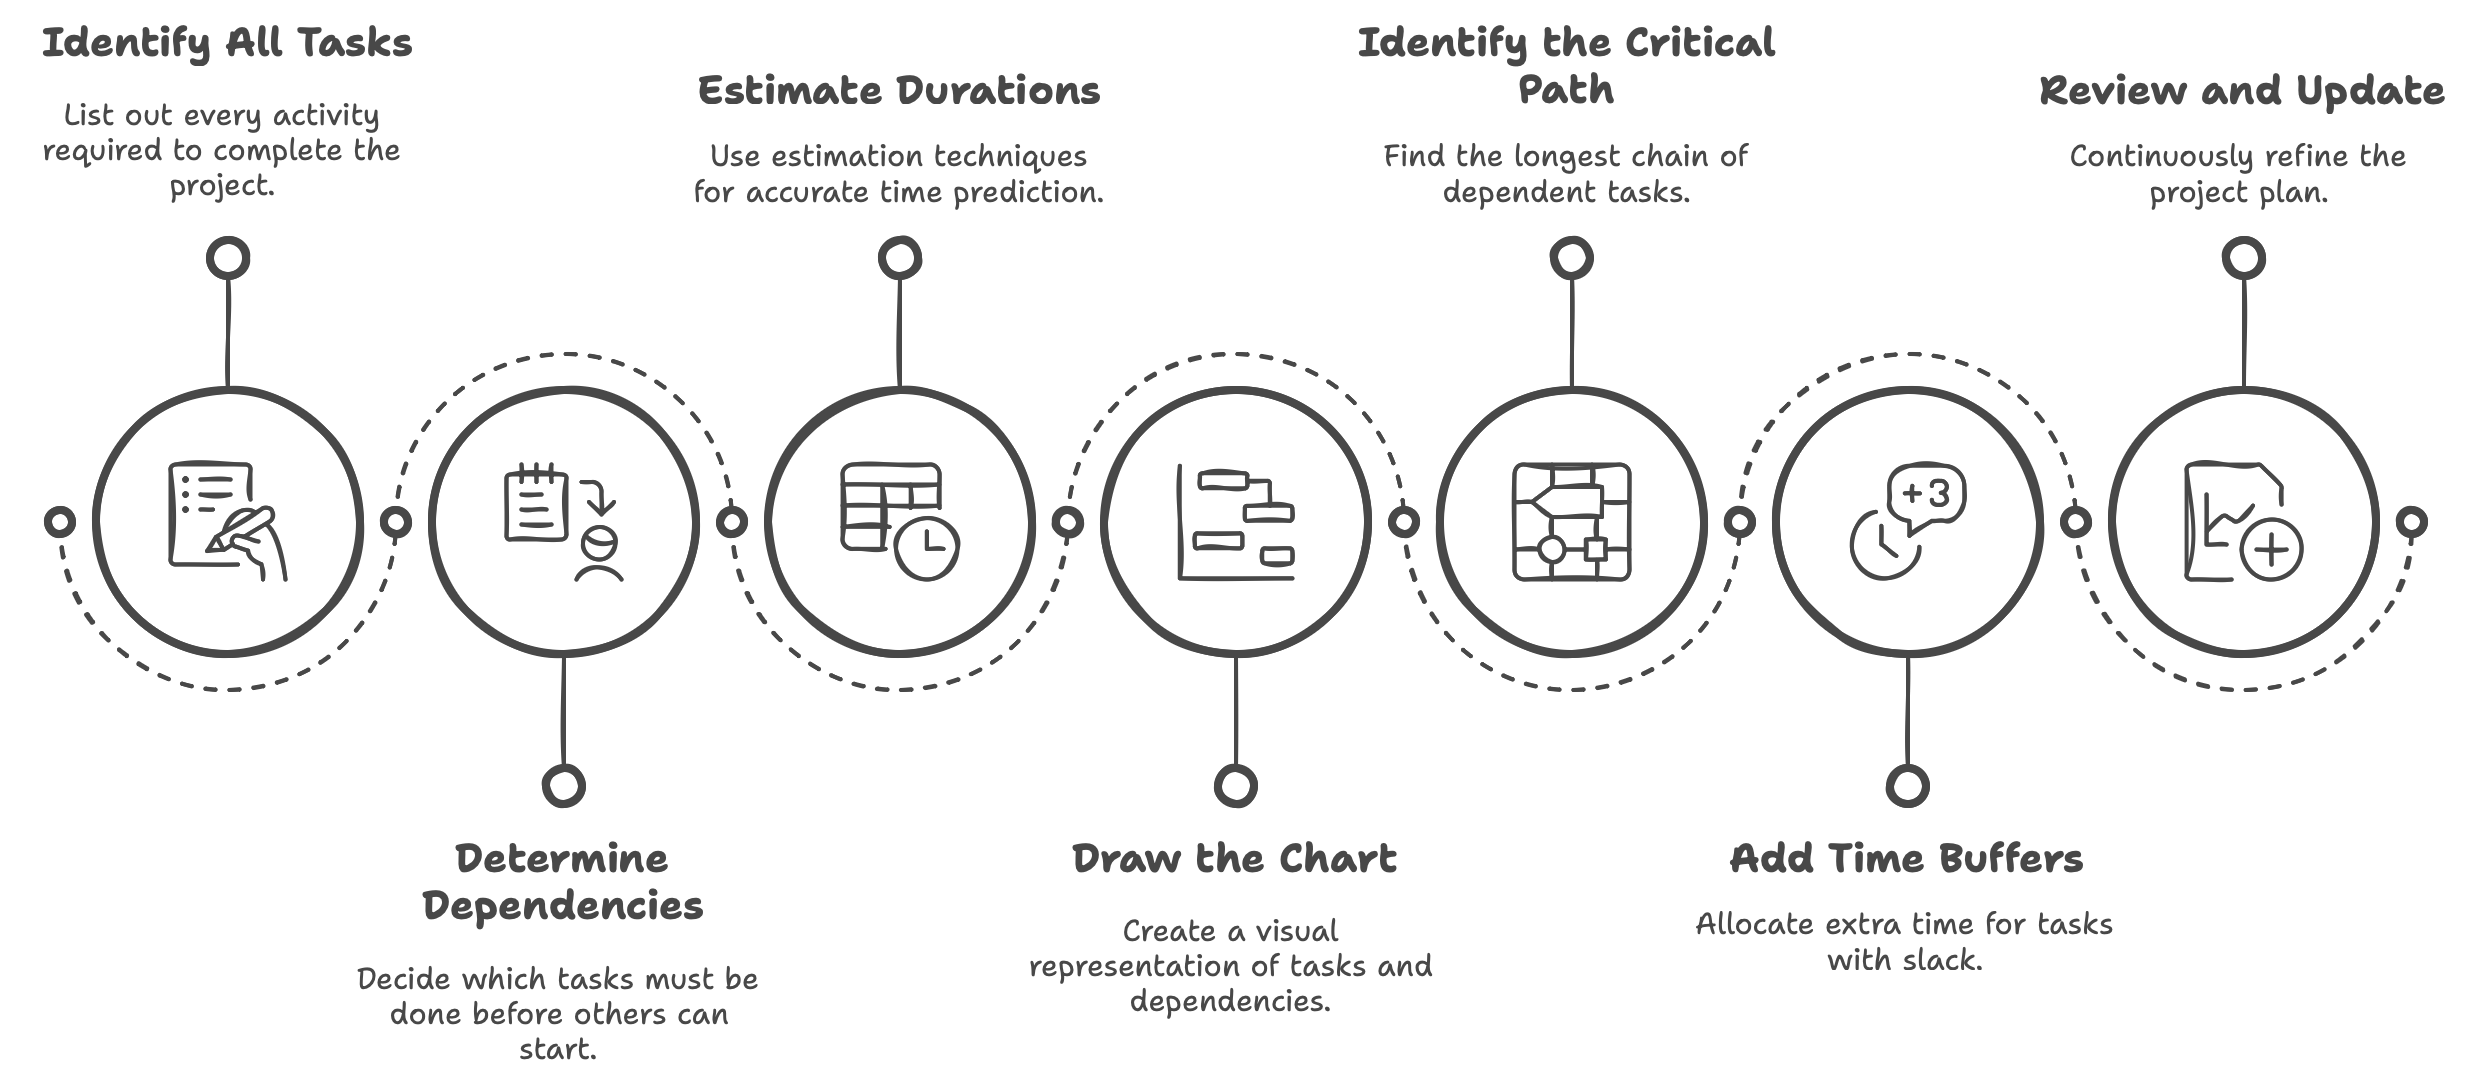
How to Create a PERT Chart Step-by-Step
  1. Identify All Tasks

    • List every activity needed to complete the project.
    • Think in detail about phases or deliverables (consider mindmapping if you need a creative approach).
  2. Determine Dependencies

    • Decide which tasks must finish before others can start.
    • Group tasks that can run in parallel.
  3. Estimate Durations

    • Use PERT’s three-point estimation (Optimistic, Most Likely, Pessimistic) for a more accurate average.
    • Or define a single duration if you have reliable data on the tasks.
  4. Draw the Chart

    • Usually, activities are represented as nodes (boxes).
    • Arrows show dependencies between tasks.
    • Keep the flow logical and chronological.
  5. Identify the Critical Path

    • Find the longest sequence of dependent tasks that determines the shortest overall project time.
    • Tasks on the critical path have zero slack.
  6. Add Time Buffers

    • Pinpoint tasks that have float (slack) without impacting the overall schedule.
    • Be mindful that delays on critical-path tasks can shift the entire project.
  7. Review and Update

    • Keep durations, dependencies, and resources current.
    • Recalculate the critical path whenever there are major project changes.

When to Use a PERT Chart vs. Other Tools

PERT Chart

Modern project management involves numerous methodologies and tools, each serving different project types and sizes:

PERT vs. Gantt

  • Gantt Chart: Displays tasks along a time axis, making scheduling and resource allocation straightforward. Perfect for a quick, linear overview.
  • PERT Chart: Offers deeper insight into dependencies and helps identify potential delays early on. Ideal for larger, more complex projects.

PERT vs. Kanban

  • Kanban: Focuses on workflow and limiting work in progress for continuous delivery, typical in agile or lean settings.
  • PERT Chart: Emphasizes sequential planning and critical-path analysis. Best for projects with complex task interdependencies.

PERT vs. Other Agile Methods (e.g., Scrum)

  • Scrum: Relies on iterative sprints and daily standups, ideal for evolving requirements.
  • PERT Chart: Fits more traditional or hybrid setups where precise scheduling and dependency mapping is crucial.

Key Consideration: PERT can be adapted into hybrid frameworks. Some teams use a PERT chart for overall scheduling and Kanban or scrum boards for daily task management.


Example: Calculating a Task’s Duration with PERT

Imagine you have a task: Develop Prototype

  • Optimistic (O): 5 days
  • Most Likely (M): 8 days
  • Pessimistic (P): 14 days

Using the PERT formula:

TE = (O + 4M + P) / 6
TE = (5 + 4*8 + 14) / 6
TE = (5 + 32 + 14) / 6 = 51 / 6 ≈ 8,5 days

Thus, you’d plan around 8.5 days for the task. Many project management tools allow you to enter three time estimates and perform these calculations automatically.


Practical Tips

  1. Combine PERT with Software: Tools like Merlin Project automate net plan creation. Focus on tasks, dependencies, and estimates—let the software do the heavy lifting.
  2. Use Templates and Views: Many apps provide net plan, mind map, or other view templates. Adapt or reuse them to save time.
  3. Start Broad, Then Refine: Don’t go overboard with details initially. Drill down only where it provides real value.
  4. Communication Matters: Make sure your team knows how to read and interpret the chart. Provide a legend for PERT-specific symbols.
  5. Review Regularly: A PERT chart should be a “living document.” Revisit it whenever major scope or schedule changes occur.

Conclusion

A PERT chart is far more than a static diagram—it’s a strategic planning tool that helps you conceptualize complex projects, pinpoint the critical path, and incorporate uncertainty into time estimates. While it can require more effort to set up compared to simpler methods like Gantt Charts or Kanban boards, it excels in bringing clarity to large-scale, multifaceted projects.

  • For Complex Projects: PERT’s analytical depth justifies its complexity.
  • For Smaller Projects: Simpler methods can suffice and be more user-friendly.
  • For Hybrid Approaches: Combine PERT for overarching planning with agile or lean tools for day-to-day execution.

With modern software automating the calculations, learning curve, and chart updates, incorporating PERT into your workflow can elevate your project management capabilities.

Posted by Stefanie Blome on March 25th, 2025 under Project Management
Tags: pert-chart merlin-project

Merlin Project on the Mac and iPad

Your ideas, our magic – make projects easy! Test now 30 days for free.

-->