Gantt charts have been a cornerstone of project management for over a century. But how do they fit into modern workflows? In this guide, we’ll explore the evolution of Gantt charts, break down their essential features, and show you how to create one step by step. Let’s dive in!
Introduction to Gantt Charts

Imagine you’re overseeing the construction of a multi-story building. Multiple teams — architects, engineers, builders, and suppliers — all need to know precisely when to start their tasks and when they must be completed. They have different responsibilities, but their work is deeply interconnected. A delay in structural design affects the foundation work, impacting framing, plumbing, and finishing tasks. If just one link breaks, the entire project schedule could shift—perhaps by weeks or even months.
Gantt charts provide a timeline-based visualization of who’s doing what, when it needs to be done, and in what order tasks should unfold. It’s a staple of traditional project management — so universal that even non–project managers likely encountered one at some point. In modern workflows, Gantt charts maintain their relevance by bringing clarity, structure, and predictability to any project, regardless of industry or scale.
Why Use a Gantt Chart?
Gantt charts help you see the full puzzle of your project. By mapping tasks along a calendar, you:
- Spot dependencies: Which tasks can only begin after others finish?
- Predict resource needs: Assess who’s available and when, so no one’s overloaded.
- Track milestones: Pinpoint critical moments like a project’s start, phase completion, or final delivery.
Moreover, Gantt charts let you drill down into tasks for cost tracking, risk assessment, and real-time updates. They offer transparency that keeps everyone aligned and fosters accountability throughout the project’s life cycle.
The chart’s real value lies in the fact that it shows instantly what work should be done, and when.
Henry Gantt (Creator of the Gantt Chart)
Origin and Definition of Gantt Charts
Over 200 years ago, the development of what we today call a bar chart began. One of the earliest sources of inspiration was the British polymath Joseph Priestley (1733–1804). Although he is best known for his scientific work – such as the discovery of oxygen – he already presented ideas in his timeline illustrations on how processes could be visually rendered in an understandable way.
Building on these early initiatives, the Polish engineer Karol Adamiecki (1866–1933) developed what is known as the “Harmonogram” in 1896. He presented it in 1903 to the Society of Russian Engineers, demonstrating how tasks and processes can be arranged in the form of bars along a timeline. Since Adamiecki published his research only in Polish and Russian, it initially did not gain much recognition in the West. Nevertheless, the Harmonogram is regarded as an important milestone in the history of bar charts.
In Germany, Hermann Schürch (1881 - 1957) published plans for a construction project in 1912 that were similar to today’s Gantt chart. Although connections between individual tasks were still missing, the basic idea of a time-ordered bar representation was already clearly discernible. However, these works remained largely confined to a specialist audience and did not yet lead to widespread use in business and industry.
It was not until the American mechanical engineer and management consultant Henry L. Gantt (1861–1919) that the concept eventually gained worldwide acceptance and recognition. Gantt studied at the Stevens Institute of Technology, worked for various steel companies, and dealt intensively with methods to optimize manufacturing processes. He refined the idea of the bar chart into what later became known as the “Gantt General Control Production Chart.” Through his publications and consulting work, the diagram gained widespread use, and the term “Gantt chart” has persisted to this day.
Thus, while the Gantt chart is based on many earlier contributions, it was Henry Gantt’s structured presentation and consistent use in production operations that were decisive in establishing it in project management. Whether in shipbuilding during World War I or modern software development: thanks to its clear depiction of tasks, deadlines, and resources, the Gantt chart has become an indispensable tool.

A Gantt chart is typically a two-axis diagram:
- The vertical axis lists tasks, grouped by phases or categories.
- The horizontal axis represents the project’s timeline in days, weeks, or months, depending on the project’s scope.
Across the chart, each task is a horizontal bar that stretches from the planned start date to the planned finish date. Task dependencies are often displayed via connecting lines or arrows, illustrating how certain tasks must wait for others to complete (or partially complete) before they can begin. In essence, a Gantt chart is your dynamic roadmap, detailing the when and how long of each task.
The Traditional Roots of Gantt
Unlike agile frameworks such as Kanban or Scrum, Gantt-based planning is more structured and predictive. Tasks are carefully scheduled up front, with assigned durations and start-finish relationships. This approach — sometimes called Waterfall — is well-suited for projects where the scope is relatively stable, or you have strong confidence in how work should proceed. Construction, event planning, hardware manufacturing, and many corporate initiatives still rely heavily on Gantt charts for precisely this reason.
Where Gantt Shines
-
Predictable Schedules:
When your project depends on well-defined stages (e.g., design, approval, construction, and inspection), Gantt charts help outline each phase and highlight the critical path. -
Fixed Deadlines:
Gantt charts excel where you must coordinate many interdependent tasks to hit a set end date. For instance, launching a product at a trade show requires you to finalize prototypes, marketing materials, and logistics in perfect sequence. -
Stakeholder Communication:
Sponsors or clients often prefer a “big-picture” timeline showing what’s happening and when. A Gantt chart provides that overview at a glance, which fosters trust and clarity.
Let our advance worrying become advance thinking and planning.
Winston Churchill
Use Cases of Gantt
Gantt charts have an incredibly broad range of applications. Here are some of the most common ones:
Large-Scale Construction
From building stadiums to renovating homes, construction projects revolve around a well-structured, time-based sequence. Dependencies such as “foundation must be poured before framing” are mission-critical. Gantt charts help synchronize contractors, manage supply deliveries, and set interim deadlines.
Event Planning
If you’re orchestrating an open house for your company, you’ll have tasks for venue setup, catering, marketing, speaker scheduling, and guest invitations — all leading up to the event date. A Gantt chart ensures you don’t overlook details that must happen first, like booking the venue before designing invitations.
Traditional Software Development
Even though software is intangible, many dev teams still use Gantt charts to plan releases, especially in waterfall or hybrid environments. You can see tasks like “Requirements Gathering,” “Coding,” “Testing,” and “Deployment” lined up with clear end dates.
Corporate Initiatives and Marketing Campaigns
When your marketing department launches a new product, there’s a timeline of concept creation, content production, ad campaign setup, and final launch date. Gantt charts visually connect each stage to highlight cross-departmental dependencies.
Planning is bringing the future into the present so that you can do something about it now.
PMI (Project Management Institute)
Creating a Gantt Chart: Step-by-Step Guide

You’re sold on the idea, so how do you build one? Although Gantt charts can become quite sophisticated, they’re easy to set up in a basic form:
-
Identify Your Activities
Break down the project into a list of activities or deliverables. This initial scoping is like an outline of your project’s “to-do” items. If you’re dealing with large tasks, consider splitting them into smaller, more manageable subtasks. -
Estimate Duration
Decide how long each task should take. You might say “5 days to create designs,” “2 weeks for vendor negotiations,” etc. These estimates come from experience, historical data, or best guesses. -
Determine Dependencies
Figure out which tasks need to wait on others. Maybe you can’t start the marketing campaign until the product’s prototype is ready. This step is crucial—it ensures tasks appear in the correct order on your timeline. -
Lay It All Out
Using a tool (even a spreadsheet, though dedicated project software is recommended), place each activity on a separate row. The x-axis, or timeline, typically runs in daily increments, but for shorter tasks you might use hours, or for bigger tasks, you might prefer weeks. -
Connect Dependencies
Draw lines or arrows between tasks that rely on each other. This visual link ensures you (and your team) know the chain of events that must occur. -
Add Milestones
Identify major checkpoints—like “Phase 1 Complete” or “Final Approval.” Mark these as milestones, which typically appear as a diamond symbol (or some variation) on your chart. -
Review and Refine
Step back and see whether the timeline is feasible. Do some tasks overlap in impossible ways? Are certain tasks assigned to the same team member, leading to an overload? Adjust as needed.
Can't wait to start yourself? Check out our checklist with 100 tasks for every project.
Tips & Tricks
While mastering the fundamentals is crucial, dodging those common pitfalls can supercharge your progress. Check out our curated list of tips and tricks that help you steer clear of mistakes and skyrocket your success.
But wait, we want to hear from you! Do you have game-changing tips that have transformed your workflow? Don’t keep them to yourself — share your insights with us. We’re eager to add your expert advice to our ever-growing list of secrets to success!

Keep It Hierarchical
A Gantt chart is most powerful when it’s clearly organized. Group related activities under phases or categories. This grouping creates a hierarchical structure. For instance, an event plan might break down into:
- Venue and Logistics
- Guest Management
- Marketing and PR
- Program and Sessions
- Post-Event Follow-Up
Within each group, add tasks and subtasks that collectively deliver that phase.
Use Milestones Wisely
If everything becomes a milestone, then nothing stands out. Milestones represent key events, such as official approvals or critical delivery dates. They’re not tasks you “work on” but checkpoints that show a significant shift or completion of a major piece.
Whenever I create a project plan, I set milestones at least at the top level between the phases. That way, I always have a status at every board meeting without getting lost in the details.
Frank Blome, CEO at ProjectWizards, 40+ years of project management experience
Build in Buffers (Lead/Lag)
Real projects rarely proceed exactly as planned. Unexpected delays happen. Gantt charts can incorporate lead/lag.
- lead = start a task earlier than the dependency’s end
- lag = add extra time between tasks to provide a buffer
For instance, you might insert a lag of two days between the finishing of design work and the start of production to account for feedback cycles.
Regularly Revisit the Schedule
A Gantt chart isn’t static. As tasks complete earlier (or later) than expected, update the chart. Revisions keep your schedule relevant and maintain trust with stakeholders.
Structure the plan flexibly
Only define exact dates in the plan if they are necessary from a project perspective. Leave the scheduling of the other activities to Merlin Project – and thus benefit from the best possible use of a project management software. You can do this by assigning a duration to activities, linking all activities and assigning fixed dates to selected dates.
For many of the participants in my training courses, this change in workflow is the key to making working with the software easier: instead of giving each process a start and end date, only selected processes (usually milestones) in the project are given a date. If these absolutely have to be on a specific date, they can even be fixed - and thus not be lost sight of during project planning.
Kathrin Lamm, Certified Merlin Project Trainer
Engage the Team Early
Don’t create your entire schedule in a silo. Involve people who’ll actually do the work. They often know best how long a task requires and how dependent tasks might overlap.
Gantt Charts on Mac, iPad & i
Phone with Merlin Project

When choosing a Gantt chart tool, consider the delivery method. While cloud-based applications promise platform independence, locally installed solutions provide tighter security and a user interface optimized for your operating system. This is particularly relevant for projects that rely on confidentiality.
Unlike many cloud-only project management tools, Merlin Project is natively built for macOS and iOS. This local installation ensures enhanced data security and seamless integration with the macOS user experience.
Merlin Project brings traditional project management into a single integrated platform. Create activities and add dependencies, track costs, manage risks, and monitor resources — all within the same environment.
Let’s explore the Gantt experience in Merlin Project
At a Glance:
Project Management’s Finest
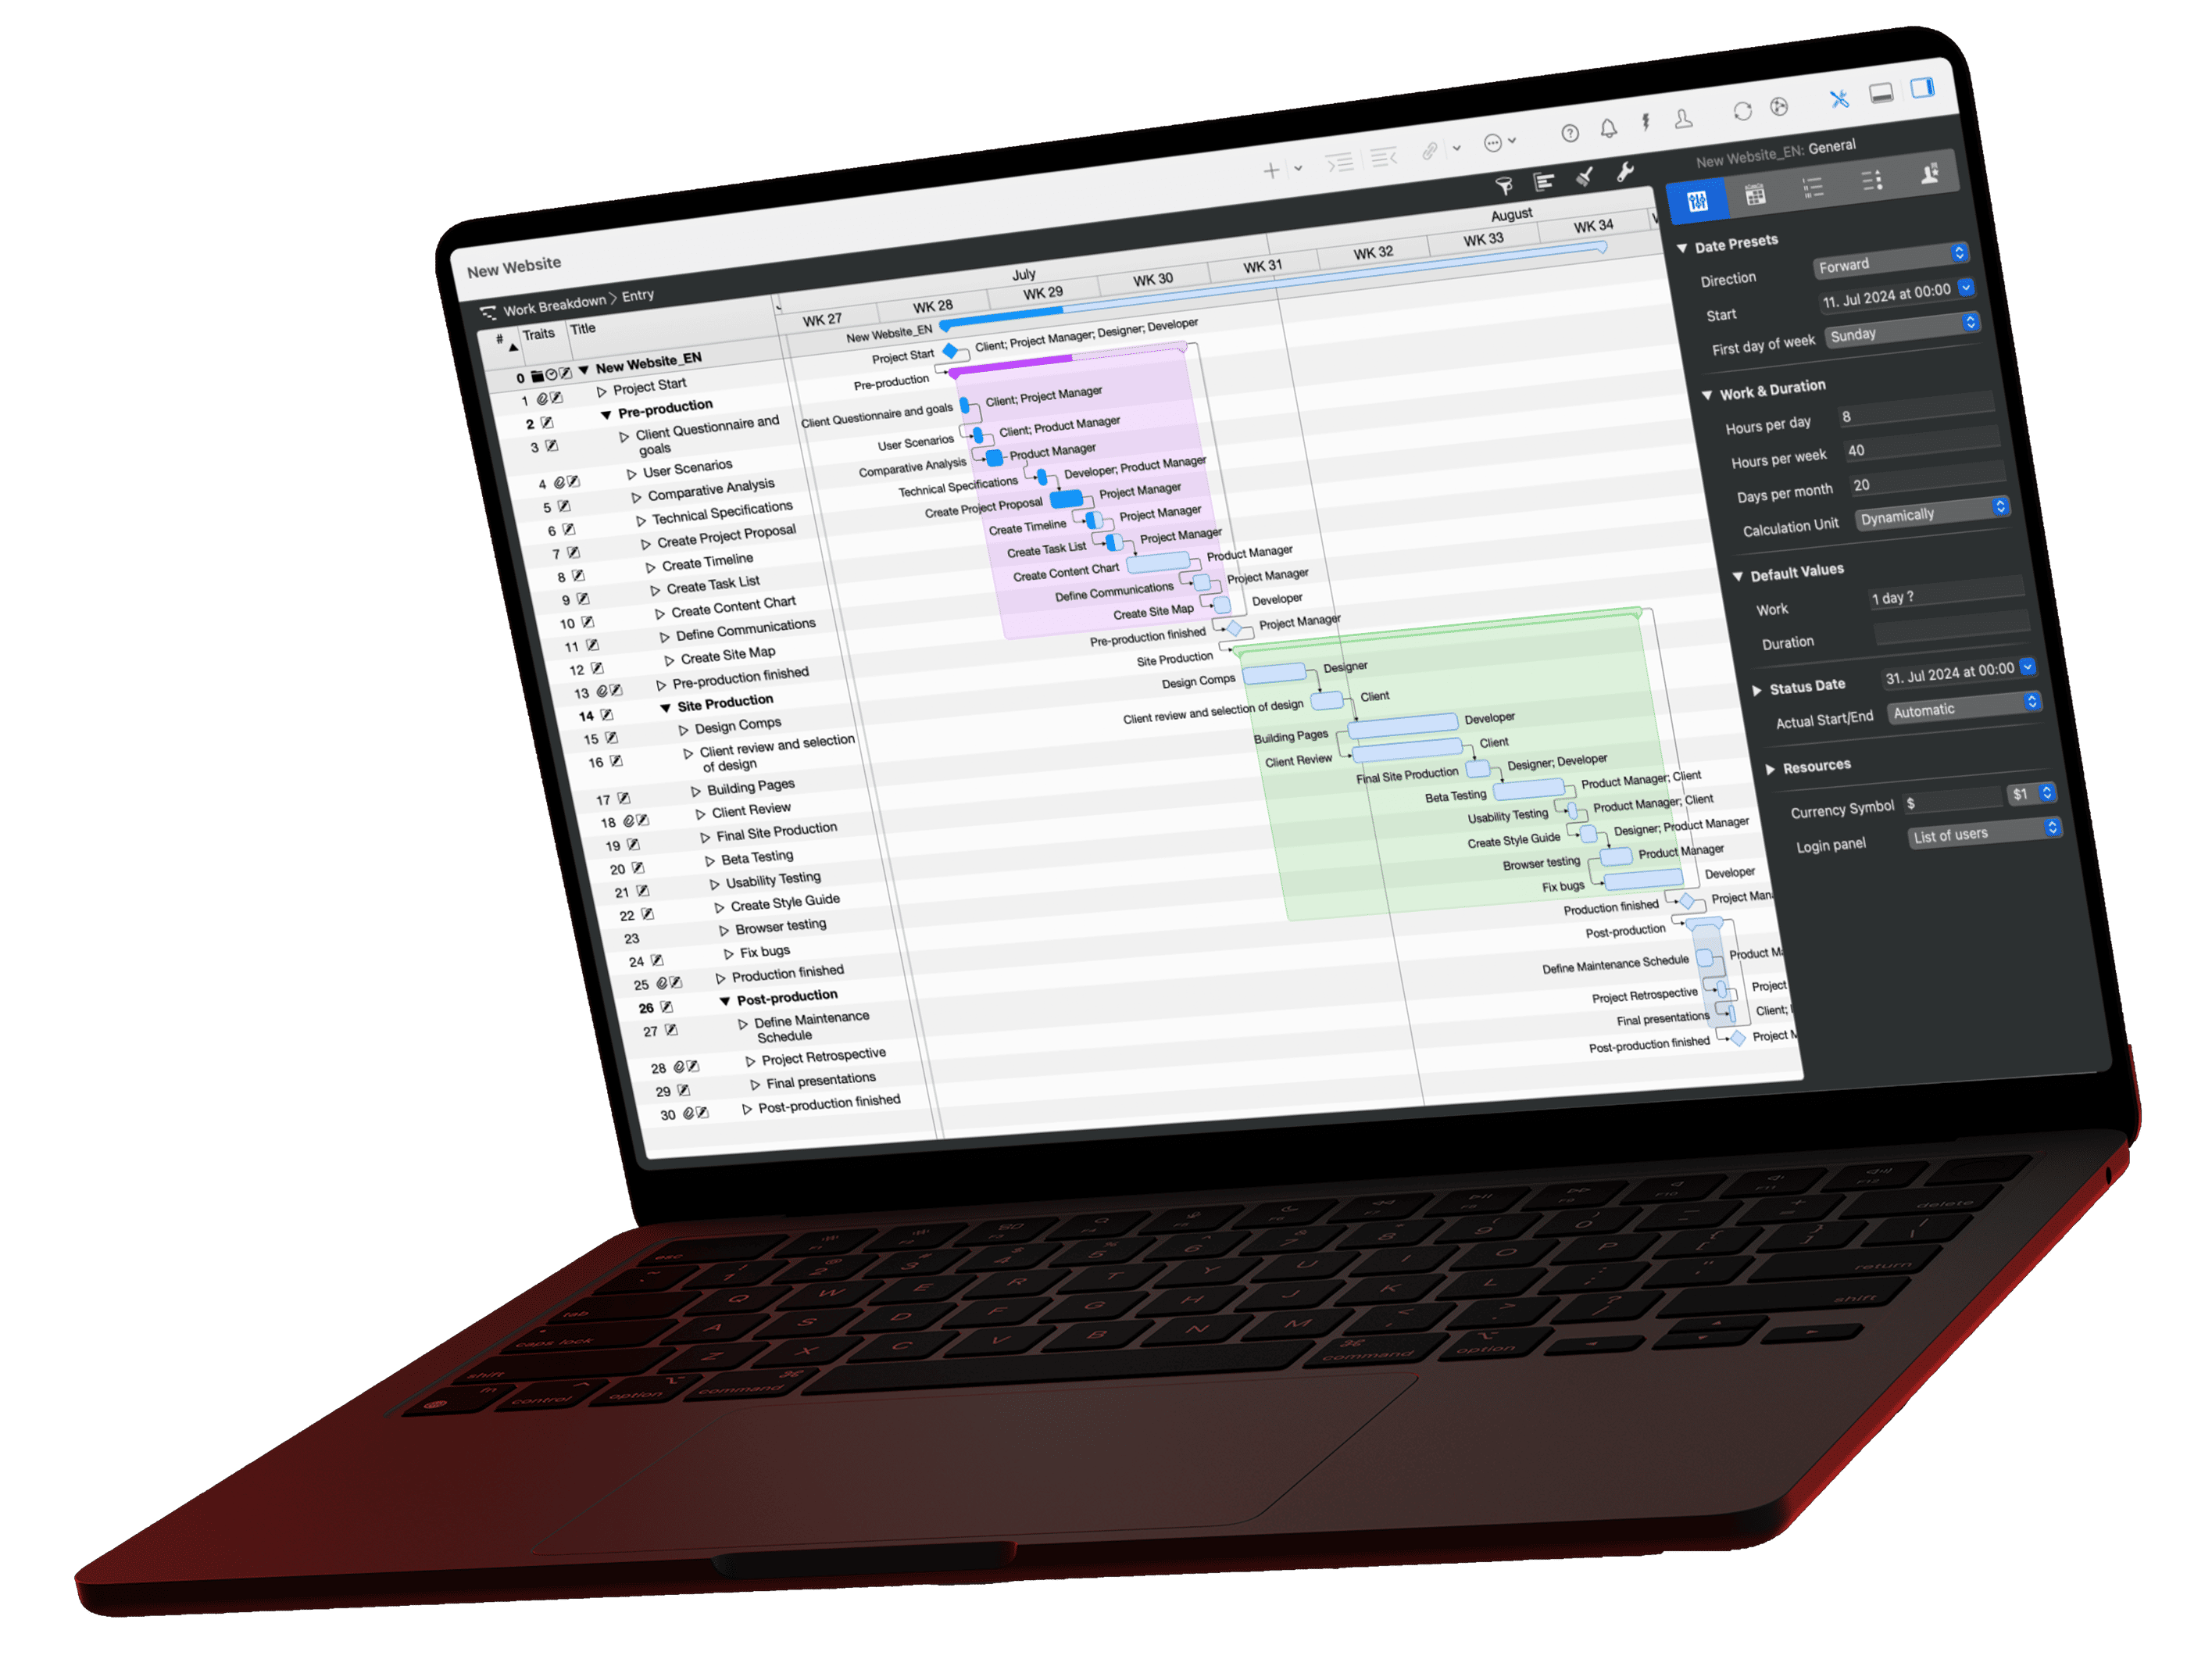
Merlin Project’s Gantt charts provide an intuitive visualization that makes project management simple. Activities are clearly listed on the left while corresponding timeline bars on the right use distinct colors to indicate planned, actual, and expected values. This clean display helps you quickly understand your project’s overall status at a glance. Building your project plan is effortless with flexible task management. You can easily create activities, set milestones, and organize your project hierarchy with intuitive grouping and indenting.
AI-Driven Planning
The AI project plan generation feature lets you generate a full project plan by simply providing a text prompt – complete with dependencies, risks, durations, groupings, and resource assignments.
Seamless Dependency Handling
Establishing task relationships is as simple as a right-click or drag-and-drop, with support for fine-tuning lead and lag times. Dynamic time displays automatically adjust your schedule when dates shift, ensuring your project timeline always remains accurate and up-to-date.
Smart Resource and Risk Coordination
Assigning and managing resources becomes straightforward as the Gantt view highlights any scheduling conflicts automatically. Alongside this, you can attach risk items directly to tasks, providing clear visibility of potential issues that might impact your timeline.
Advanced Collaboration & Customization
Benefit from multiple visual views like mind maps, network diagrams, and PERT charts, robust import/export capabilities, and real-time multi-user editing with mobile sync. Comprehensive reporting and pre-designed templates further streamline your project setup, giving you total control and insight into every detail.
Test Merlin Project 30 Days for Free. Hybrid Project Management on Mac, iPad and iPhone.
Conclusion
Gantt charts have proven their lasting value by guiding projects for over a century. They bring a structured, timeline-focused perspective that remains invaluable in large-scale efforts, fixed-deadline scenarios, and any context requiring detailed scheduling. While agile methods like Kanban or Scrum can help when scope is fluid or when continuous iteration is key, Gantt remains indispensable where clarity, predictability, and comprehensive planning are required. Gantt charts help you see the forest and the trees.
Whatever we do must be in accord with human nature. We cannot drive people; we must direct their development.
Henry Gantt
FAQs (Frequently Asked Questions)
What is a Gantt chart?
A Gantt chart is a timeline-based bar chart used to plan, schedule, and track the progress of projects. It displays tasks along a horizontal time axis, showing their start and end dates, durations, and dependencies, which helps visualize the entire project workflow.
Who invented the Gantt Chart and what is its origin?
The idea of a bar chart for visualizing processes goes back to several pioneers. Joseph Priestley presented the first timeline illustrations in the 18th century. Karol Adamiecki developed the "Harmonogram" in 1896, Hermann Schürch published similar diagrams for construction projects in 1912. Henry L. Gantt adopted these ideas, refined them in the early 20th century, and made them internationally known.
What are the primary benefits of using a Gantt chart in project management?
Gantt charts offer clear visualizations of project timelines and task dependencies, which facilitate effective scheduling, resource allocation, and progress tracking. They help project managers quickly identify bottlenecks, ensure milestones are met, and maintain overall project alignment.
How do Gantt charts differ from agile project management methods like Kanban or Scrum?
Gantt charts follow a traditional, predictive approach that requires detailed upfront planning and fixed schedules, whereas agile methods like Kanban or Scrum emphasize iterative development, flexibility, and continuous improvement. This makes Gantt charts ideal for projects with well-defined stages and fixed deadlines.
What are some common use cases for Gantt charts?
Gantt charts are widely used in scenarios such as large-scale construction projects, event planning, traditional software development, and corporate initiatives. They excel in environments where task sequencing, dependency management, and clear deadline tracking are critical.
What are the essential steps to create a Gantt chart?
To create a Gantt chart, begin by identifying all project tasks and deliverables, then estimate each task’s duration. Next, determine the dependencies between tasks, lay them out on a timeline, connect dependent tasks with lines or arrows, and finally, add milestones to mark key project checkpoints.
How are task dependencies managed in a Gantt chart?
Task dependencies are managed by visually linking related tasks with lines or arrows on the chart. This connection indicates which tasks must be completed before others can begin, ensuring that the project schedule accurately reflects the necessary order of operations.
What role do milestones play in a Gantt chart?
Milestones serve as significant checkpoints or achievements within a project, marking the completion of key phases or deliverables. They provide a clear indication of progress and help in tracking critical deadlines, ensuring that major project goals are met on time.
How does Merlin Project integrate Gantt charts into its project management toolkit?
Merlin Project incorporates Gantt charts by offering intuitive visualization, flexible task management, and streamlined dependency connections. The platform also supports resource coordination, cost tracking, and risk management, allowing users to manage all aspects of their project within a single, integrated environment.
What are some common pitfalls when using Gantt charts and how can they be avoided?
Common pitfalls include overcomplicating the chart, relying on inaccurate time estimates, and neglecting regular updates. To avoid these issues, maintain a clear hierarchical structure, involve team members in planning for accurate estimates, and build in buffers for unforeseen delays while continuously refining the schedule.