Glossary
Gantt

Although the Gantt chart takes its name from Henri Gantt, it was probably first used in a project by a Swiss named Joseph Priestley.
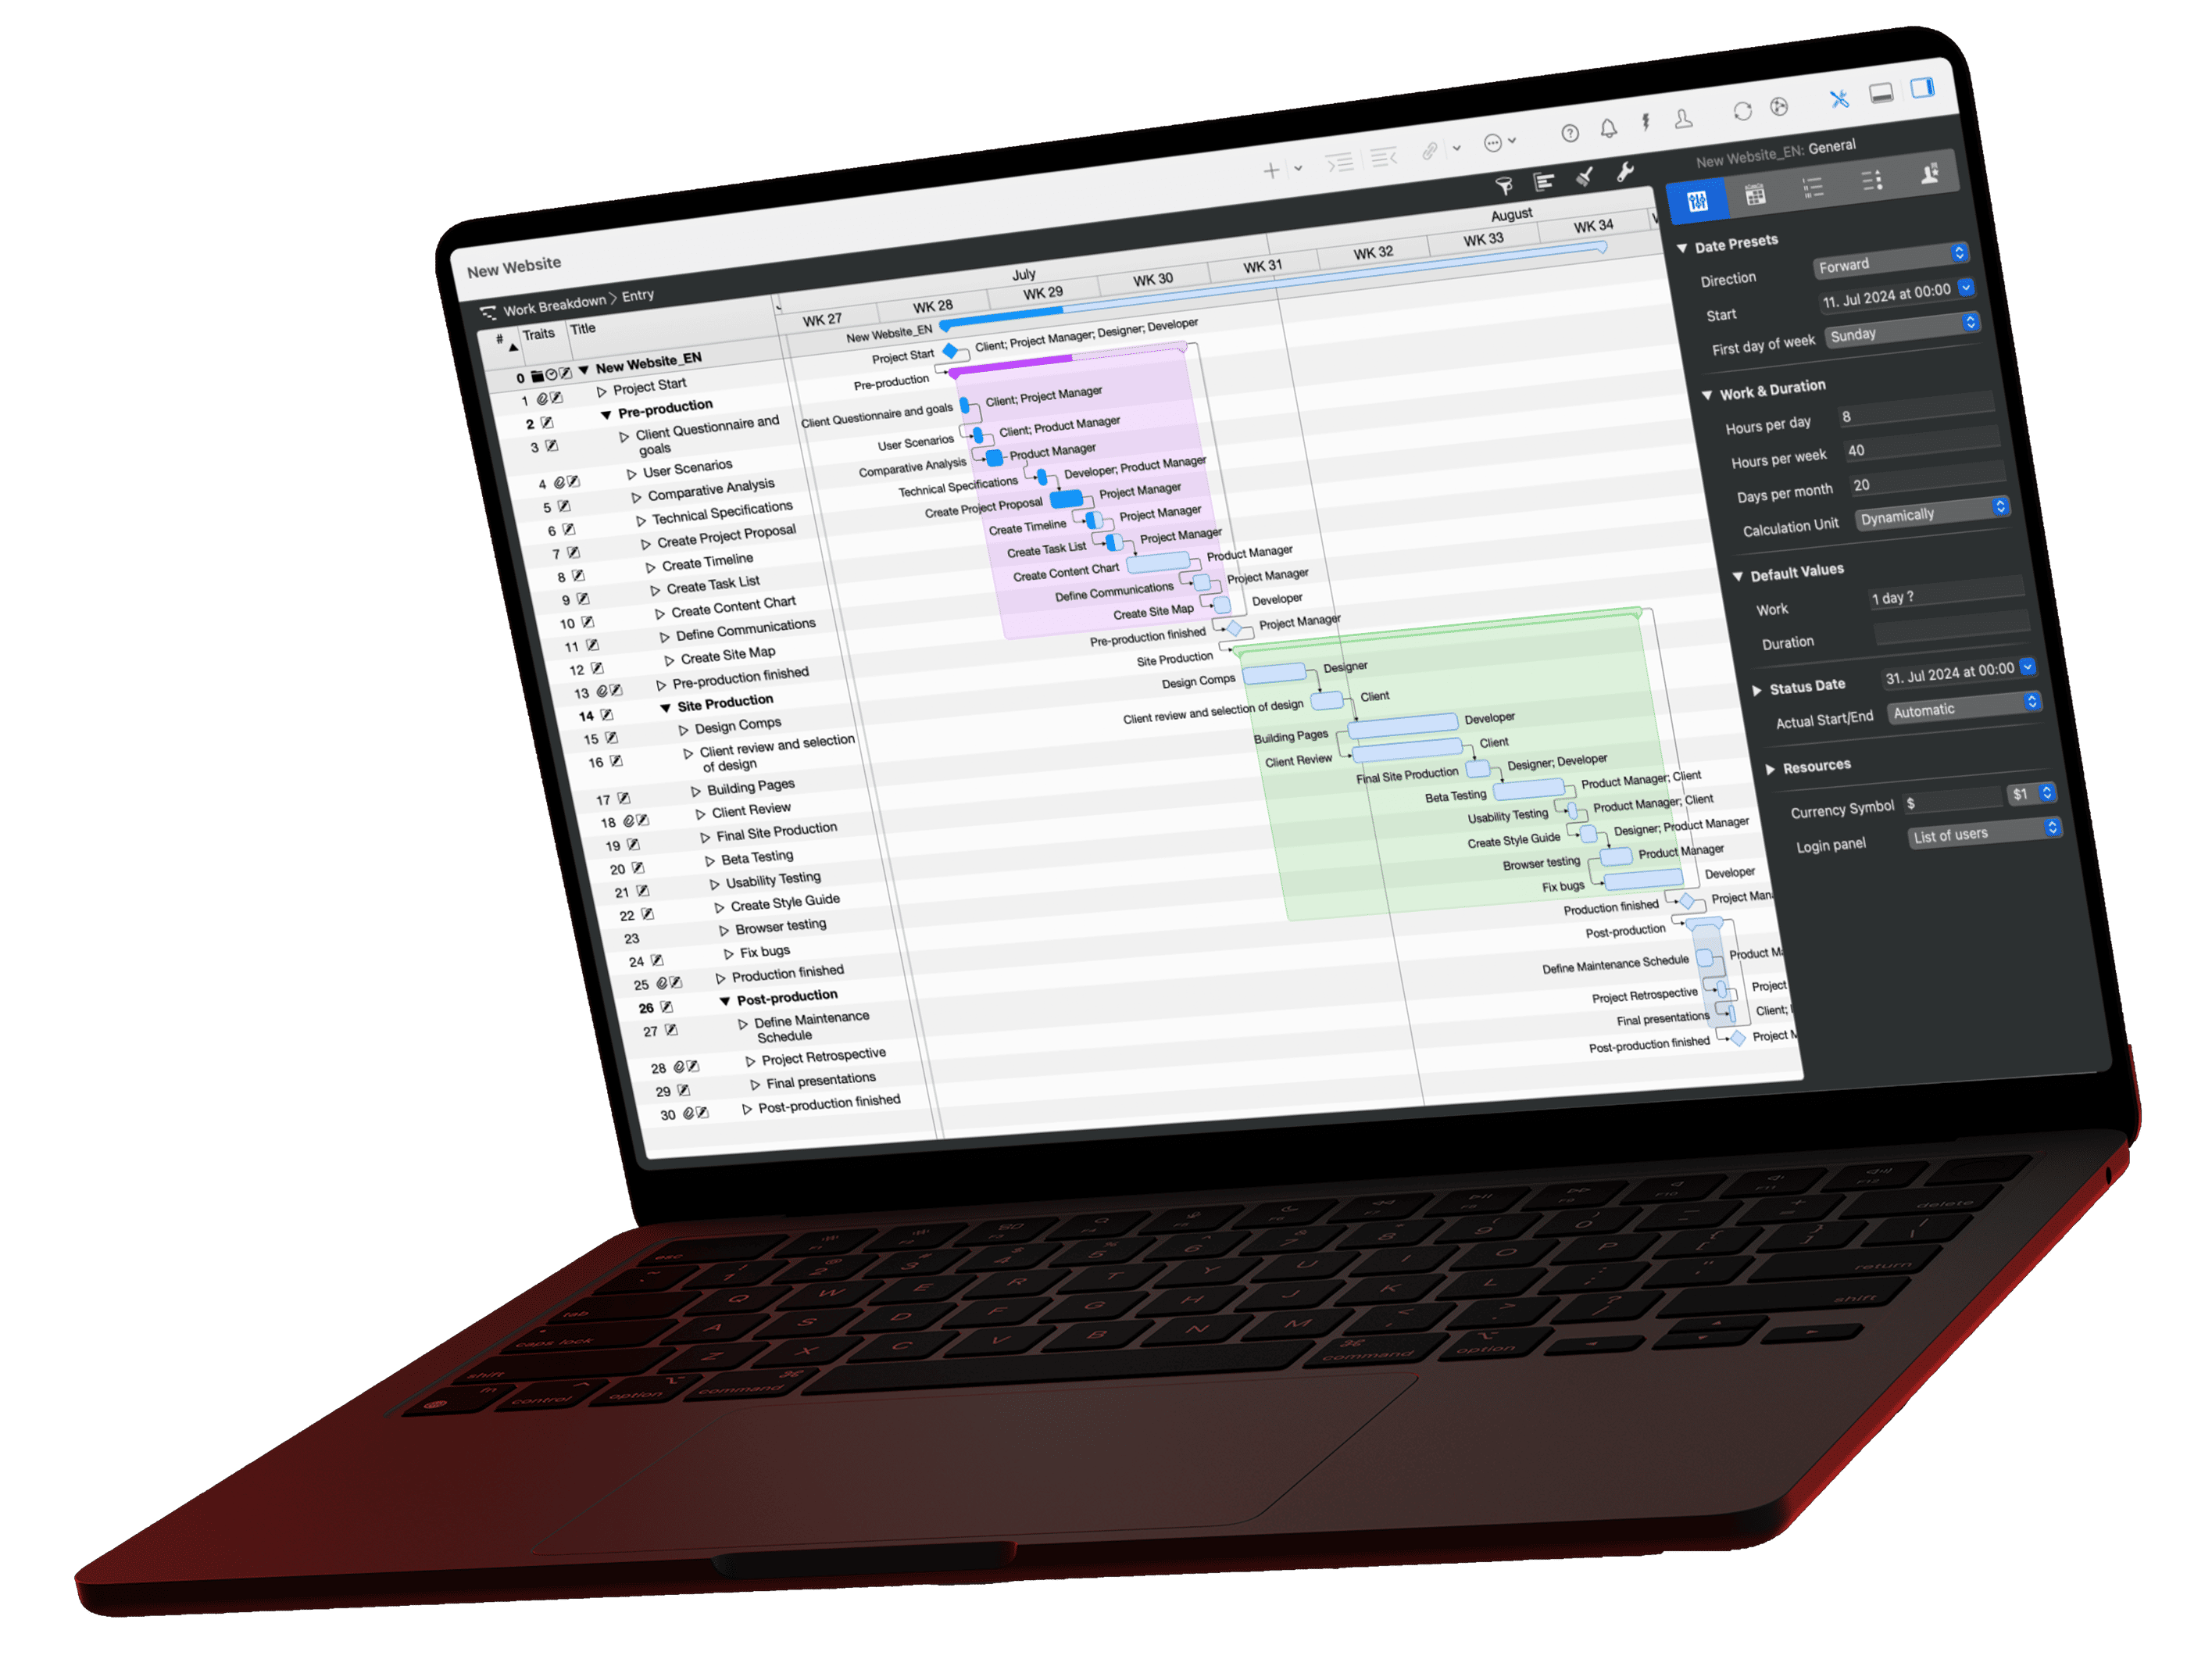
Within the diagram, the project is represented on a time axis by individual elements (bars). In addition to the bars, additional information has now also become established in the Gantt chart:
- Groups
- Activities
- Milestones
- Dependencies
- Planned vs. actual values
- and further information
In Merlin Project the Gantt diagram is integrated in many views, for example in the "Work Breakdown / Entry" or the "Plan/Actual Comparison (Time)".