The Kano model sorts product features into five categories by how they affect customer satisfaction: must-be, one-dimensional (performance), attractive (excitement), indifferent and reverse. Noriaki Kano published it with three colleagues in 1984 in the journal of the Japanese Society for Quality Control. A survey with two questions per feature determines the category.
Kano diagram
Satisfaction (vertical) against degree of fulfillment (horizontal) for the three main categories
What Is the Kano Model?
The Kano model is a quality management tool that distinguishes requirements by how strongly their presence or absence changes customer satisfaction. Its core insight: satisfaction and dissatisfaction are not mirror images. A missing feature can annoy customers even though its presence never delights them.
Noriaki Kano, Nobuhiko Seraku, Fumio Takahashi and Shin-ichi Tsuji introduced the model in the paper “Attractive Quality and Must-be Quality” (Hinshitsu, vol. 14, no. 2, April 1984, pp. 147 to 156, DOI 10.20684/quality.14.2_147). Today, product teams and project managers use it to decide which requirements belong in scope and which can wait. In the triple constraint of time, cost and scope, Kano gives the scope side a customer-based rationale. It extends the classic view of quality as conformance to specifications.
What Are the Five Categories of the Kano Model?
The Kano model distinguishes five categories, each describing a different relationship between fulfillment and satisfaction. The examples refer to a construction site app for site managers, which the worked example below also uses.
| Category | Code | When fulfilled | When not fulfilled | Example: construction site app |
|---|---|---|---|---|
| Must-be (basic) | M | neutral, taken for granted | strong dissatisfaction | offline mode in dead zones |
| One-dimensional (performance) | O | satisfaction rises with fulfillment | dissatisfaction grows with the shortfall | pin photos to the floor plan |
| Attractive (excitement) | A | disproportionate satisfaction | no dissatisfaction, nobody expects it | record defects by voice |
| Indifferent | I | no effect | no effect | dark mode |
| Reverse | R | dissatisfaction | satisfaction | automatic weekly report to the client |
A sixth answer class is not a category: Q (questionable) marks contradictory answers, such as “I like it” both when a feature is present and when it is absent. Such answers point to a misleading question.
How Does the Kano Survey Work?
The Kano survey asks a pair of questions for each feature: a functional question (“How do you feel if the app can do X?”) and a dysfunctional question (“How do you feel if the app cannot do X?”). Respondents answer both on the same five-point scale.
The answer options and the evaluation table come from the compendium “Kano’s Methods for Understanding Customer-defined Quality” by Charles Berger, David Walden and co-authors (Center for Quality of Management Journal, vol. 2, no. 4, fall 1993, PDF):
- I like it that way.
- It must be that way.
- I am neutral.
- I can live with it that way.
- I dislike it that way.
An example for the offline mode: the functional question reads “The app works without a network connection. How do you feel?”, the dysfunctional one “The app does not work without a network connection. How do you feel?”. Phrase both questions from the user’s point of view, not the technology’s, and ask the stakeholders who will actually use the feature.
The Kano Evaluation Table
The evaluation table turns each answer pair into exactly one category. The row is the answer to the functional question, the column the answer to the dysfunctional question.
| Functional ↓ · Dysfunctional → | Like | Must be | Neutral | Live with | Dislike |
|---|---|---|---|---|---|
| Like | Q | A | A | A | O |
| Must be | R | I | I | I | M |
| Neutral | R | I | I | I | M |
| Live with | R | I | I | I | M |
| Dislike | R | R | R | R | Q |
If a site manager answers “It must be that way” to the functional and “I dislike it that way” to the dysfunctional offline question, the result is M, a must-be feature. “I like it that way” plus “I am neutral” results in A, an attractive feature.
How Do You Analyze a Kano Survey? An Example With Five Features
You analyze a Kano survey by counting how often each category occurs per feature and assigning the feature to the most frequent one. Berger and colleagues call this the mode. In a tie, the order M before O before A before I applies, because that category has the greater impact on the product.
Our example: the product team of a construction site app is planning the next release and surveys 40 site managers about five features. The table shows the distribution of answers after applying the evaluation table.
| Feature | A | O | M | I | R | Q | Category (share) | Better | Worse |
|---|---|---|---|---|---|---|---|---|---|
| Offline mode | 3 | 9 | 22 | 5 | 0 | 1 | Must-be (55.0%) | 0.31 | −0.79 |
| Pin photos to the floor plan | 9 | 18 | 8 | 5 | 0 | 0 | One-dimensional (45.0%) | 0.68 | −0.65 |
| Record defects by voice | 19 | 7 | 2 | 11 | 1 | 0 | Attractive (47.5%) | 0.67 | −0.23 |
| Dark mode | 7 | 3 | 2 | 24 | 3 | 1 | Indifferent (60.0%) | 0.28 | −0.14 |
| Automatic weekly report to the client | 6 | 2 | 1 | 12 | 17 | 2 | Reverse (42.5%) | 0.38 | −0.14 |
The Better and Worse columns go back to Mike Timko, who describes them in the same compendium. They only count A, O, M and I:
- Better = (A + O) / (A + O + M + I): how much does satisfaction rise if you deliver the feature?
- Worse = −(O + M) / (A + O + M + I): how much does it drop if the feature is missing?
For the offline mode, Better = (3 + 9) / 39 = 0.31 and Worse = −(9 + 22) / 39 = −0.79. A missing offline mode hurts the most of all five features, while its presence barely delights. Pinning photos scores high in both directions (0.68 and −0.65), typical for a one-dimensional feature. Voice input delights (0.67), and its absence barely matters (−0.23).
Watch out for close results: for photo pinning, 18 O answers face 9 A and 8 M answers. Berger and colleagues recommend reading the second most frequent category as well in such cases, or analyzing user segments separately.
How Do You Prioritize With the Kano Model?
With the Kano model, you prioritize in the order must-be, one-dimensional, attractive. Indifferent features wait; reverse features are dropped or offered as an option users can switch off. For the example, that means:
- Offline mode first. Without it, you lose users no matter what else the release contains.
- Photo pinning next. Every improvement pays directly into satisfaction.
- Voice input as the attractive feature once 1 and 2 are in place.
- Dark mode postponed.
- Automatic weekly report not shipped as a default.
The Kano model says nothing about effort. Whether voice input costs two weeks or two quarters only shows up in an effort-based method such as the RICE score, which divides reach, impact and confidence by effort. For a quick split into must and could, use the MoSCoW method. Kano supplies the customer-based rationale for both.
How Do You Map Kano Categories in Merlin Project?
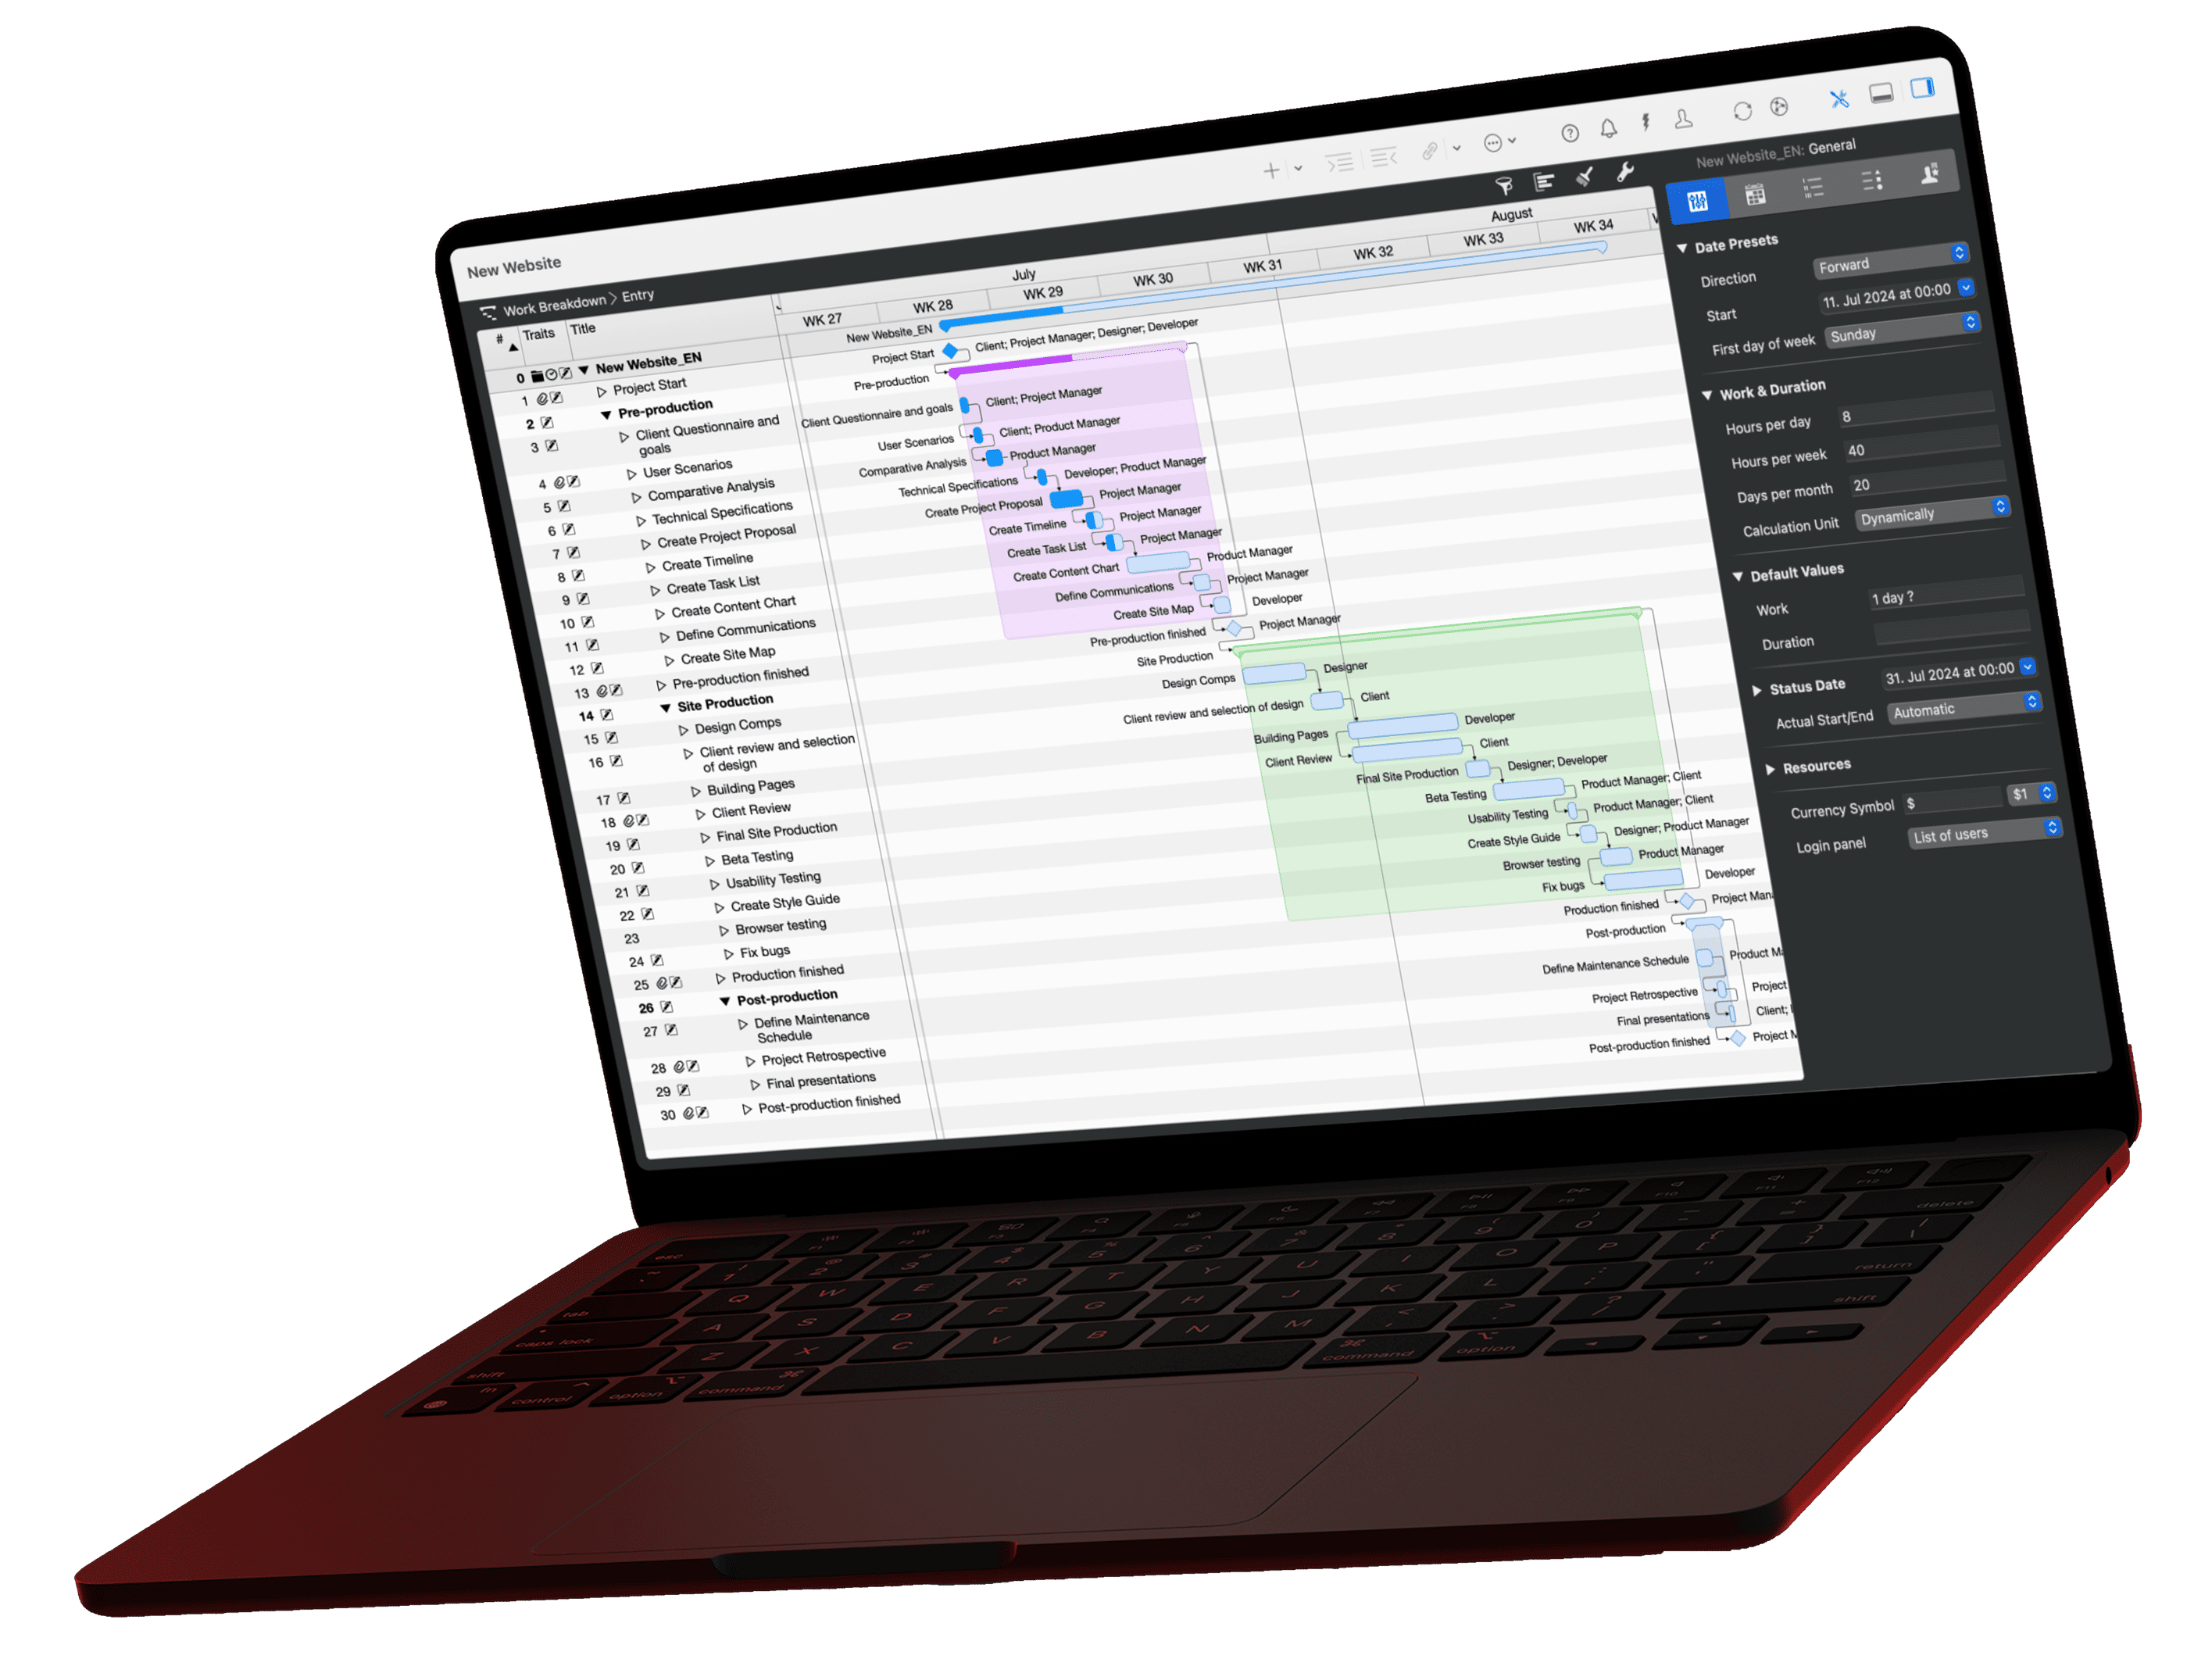
In Merlin Project, you map Kano categories with a custom field on every activity. You then group and filter the project plan by that field. Each feature of the release becomes an activity in the plan and carries its category visibly.
- Create the field: Choose Insert > Column, then For new Field, enter “Kano category” as the Field Name and confirm with Insert Column. In the column’s inspector, set the Type to Text.
- Define the values: Under Pre-defined values, enter the five categories: Must-be, One-dimensional, Attractive, Indifferent, Reverse. Leave Allow free entry off so nobody invents a sixth spelling.
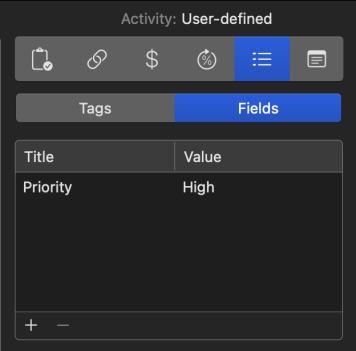
- Assign the category: Select one or more activities and, in the inspector’s User-defined tab, pick the category under Fields in the Value column. The value applies to all selected activities.
- Group by category: Under Groupings, add a custom grouping with + and choose the field “Kano category” after by under Group. With on each possible value, Merlin Project also shows categories that have no activity yet.
- Hide reverse features: Create a custom filter, choose the not logic and the condition “Kano category is equal to Reverse”. The plan then only shows the scope you actually build.
Custom fields in the inspector
On the User-defined tab, the inspector lists all custom fields of an activity with their value under Fields. The screenshot shows a field “Priority” with the value “High”; your field “Kano category” appears in the same place. Custom fields, filters and groupings are part of Merlin Project, not Merlin Project Express.
Optional, when resources are tight: Merlin Project gives every activity a Priority from 0 to 1000, found in the inspector on the Plan tab in the Advanced section. It only takes effect during resource leveling: Merlin Project schedules activities with higher priority first and delays lower ones. Map the Kano order onto the preset levels so that leveling postpones the attractive feature before the must-be feature:

- Must-be: 1,000 (Very High)
- One-dimensional: 750 (High)
- Attractive: 500 (Normal)
- Indifferent: 250 (Low)
- Reverse: not scheduled
Conclusion
The Kano model shows which features customers take for granted and which actually raise their satisfaction. One question pair per feature and the evaluation table are enough for the classification; Better and Worse show how strongly a feature works in each direction. In the project plan, you record the category as a custom field and see for every activity why it is in scope.
This article concludes our three-part series on prioritization methods, after the MoSCoW method and RICE scoring. If you have questions, send us an email.
If you have any questions about this blog article or would like to discuss it, we look forward to your contribution in our forum.
Frequently asked questions
Who developed the Kano model?
Noriaki Kano, then at Tokyo University of Science, developed the model with Nobuhiko Seraku, Fumio Takahashi and Shin-ichi Tsuji. They published it in April 1984 in the paper “Attractive Quality and Must-be Quality” in Hinshitsu, the journal of the Japanese Society for Quality Control.
What are the three factors of the Kano model of customer satisfaction?
The three main factors are must-be (basic), one-dimensional (performance) and attractive (excitement) features. Must-be features only cause dissatisfaction when missing, one-dimensional features raise satisfaction in proportion to fulfillment, and attractive features delight without being expected. Indifferent and reverse features complete the five categories.
What is the Kano model in project management?
In project management, the Kano model justifies the project scope. Must-be features belong in every scope, one-dimensional features scale with the budget, attractive features come last and reverse features are dropped. In Merlin Project, you record the category as a custom field on each activity.
What does a Q mean in a Kano survey?
Q stands for questionable, a contradictory answer pair such as “I like it” to both questions. Many Q answers for one feature point to a misleading question. Rephrase the question pair instead of interpreting the result.
Kano model or RICE: which method fits?
They answer different questions. The Kano model shows how a feature affects satisfaction and needs a survey. RICE divides reach, impact and confidence by effort and produces a ranking. Use Kano to identify must-be features and RICE to rank the remaining ones.