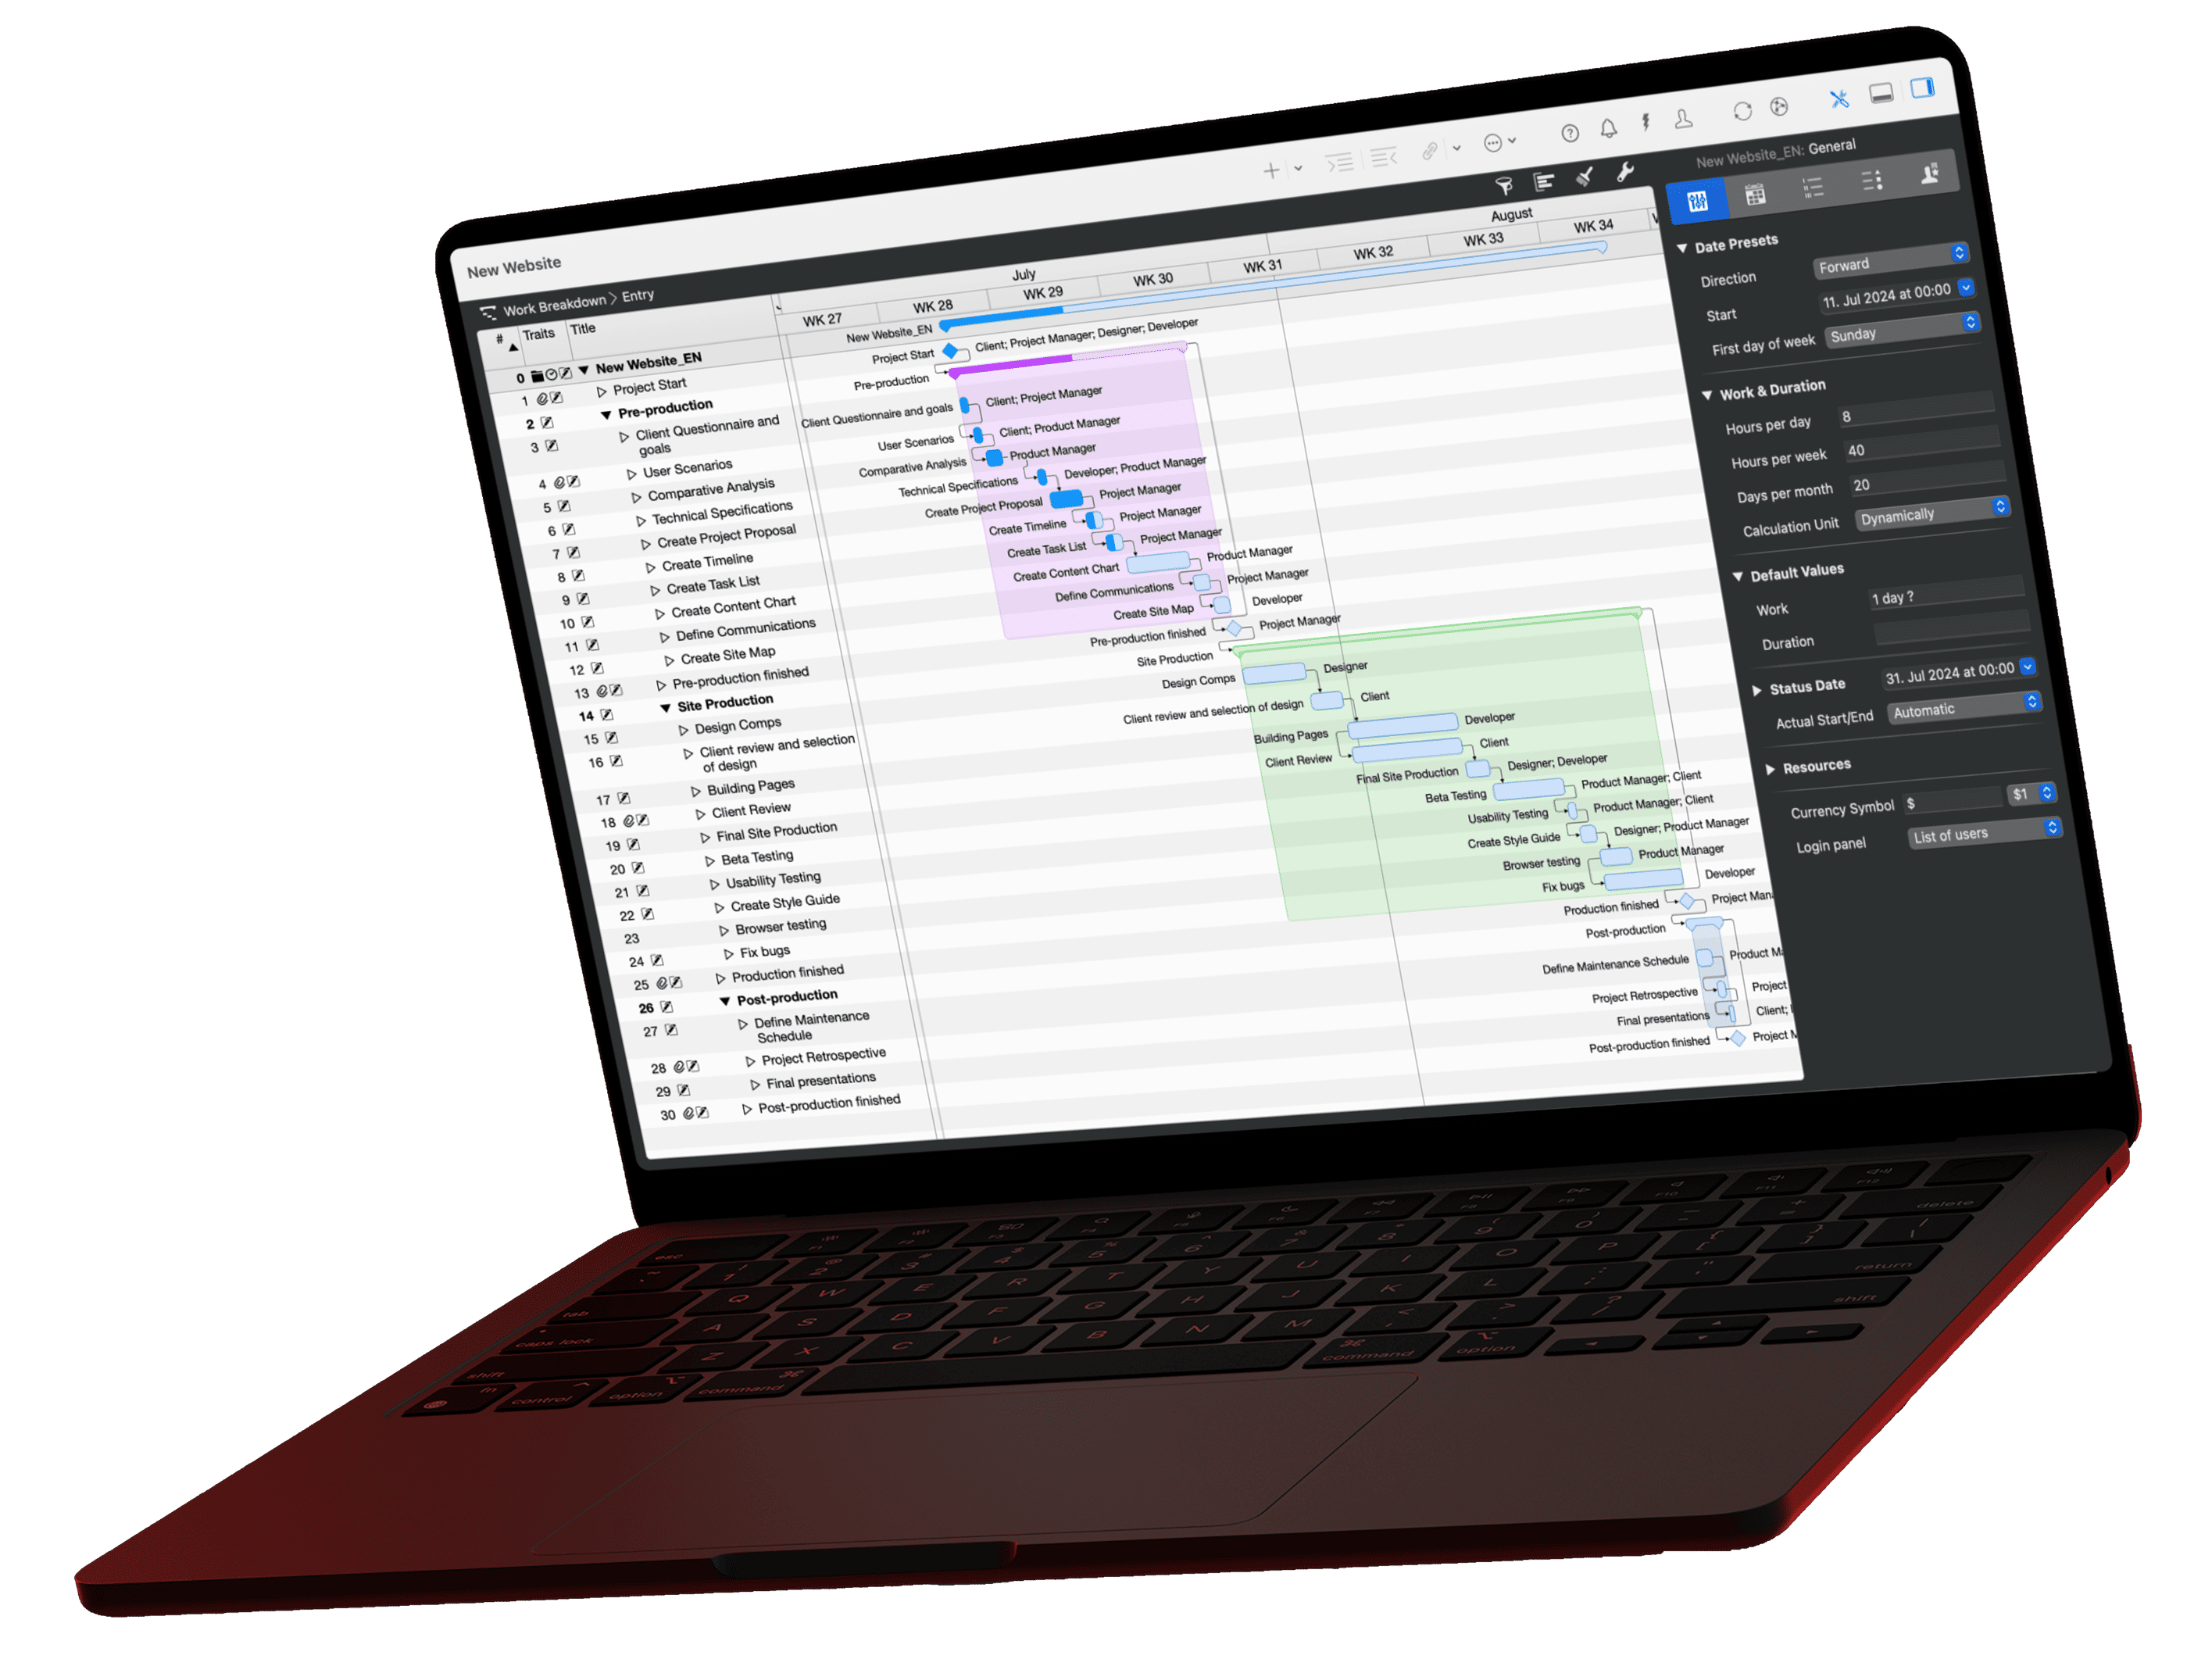
The RICE score is a prioritization metric that multiplies reach, impact and confidence and divides the result by effort: RICE = Reach × Impact × Confidence / Effort. Sean McBride developed the method as a product manager at Intercom. In the original, a five-step scale from 0.25 to 3 rates impact, and effort counts in person-months.
What Is the RICE Score?
The RICE score is a number that shows how much impact a project promises per person-month of work. The higher the score, the higher the project ranks. RICE stands for Reach, Impact, Confidence and Effort.
Sean McBride describes the method on the Intercom blog in RICE: Simple prioritization for product managers. His goal: compare ideas on the same four factors instead of letting pet projects or the loudest voice decide. The method comes from product management but fits any list of competing projects, from a feature backlog to an improvement initiative in an architecture firm.
What Is the RICE Formula?
The RICE formula multiplies reach, impact and confidence and divides the product by effort. Effort sits in the denominator because more work lowers the value of a project.
The RICE formula
Impact per person-month, scales according to Intercom
The four factors and their original scales:
| Factor | Question | Unit and scale according to Intercom |
|---|---|---|
| Reach | How many people does the project reach in a fixed period? | People or events per period; Intercom uses customers per quarter |
| Impact | How much does it change the outcome for each person reached? | 3 = massive, 2 = high, 1 = medium, 0.5 = low, 0.25 = minimal |
| Confidence | How solid are your estimates? | 100% = high, 80% = medium, 50% = low; below that, McBride calls the project a “moonshot” |
| Effort | How much work does it take everyone involved? | Person-months, whole numbers or 0.5 for well under a month |
Variants circulate, such as impact on a scale from 1 to 5 or effort in person-days. Both change the weight of the factors and therefore the ranking. Agree on the scales once as a team and don’t switch them between two scoring rounds. For a solid effort estimate, use three-point estimation.
How Do You Calculate the RICE Score? An Example With Five Projects
You calculate the RICE score by estimating the four values for each project, applying the formula and sorting the projects by the result in descending order. The absolute value says little; what counts is the ranking within one list that uses the same units.
Our example: the product team of a construction site app with 3,000 active users per quarter chooses from five projects for the next release. Reach counts users per quarter, effort person-months.
| Project | Reach | Impact | Confidence | Effort | RICE score | Rank |
|---|---|---|---|---|---|---|
| Dark mode | 3,000 | 0.25 | 80% | 0.5 | 1,200 | 1 |
| Extend offline mode | 2,400 | 2 | 80% | 4 | 960 | 2 |
| Pin photos to the floor plan | 1,800 | 1 | 100% | 2 | 900 | 3 |
| PDF defect report | 1,200 | 1 | 80% | 1.5 | 640 | 4 |
| Record defects by voice | 900 | 2 | 50% | 1.5 | 600 | 5 |
Ranking by RICE score
Calculation for rank 1: 3,000 × 0.25 × 0.8 / 0.5 = 1,200
Two observations from the example:
- Confidence tips the ranking. If confidence in dark mode drops from 80 to 50%, its score falls to 3,000 × 0.25 × 0.5 / 0.5 = 750. It slips behind offline mode (960) and photo pinning (900) to rank 3. When gaps are small, check which estimate carries the result.
- RICE knows no must-haves. We surveyed 40 site managers about the same app in our article on the Kano model: offline mode is a must-be feature there, dark mode is indifferent. You deliver a must-be feature regardless of its score, or you lose users. Take such features off the list before scoring.
What Are the Limits of the RICE Method?
The RICE method produces a ranking, not a decision. Know these four limits:
- False precision: A score of 960 sounds exact but rests on four estimates. Lower confidence in photo pinning from 100 to 80% and its score drops from 900 to 720.
- No dependencies: RICE scores each project in isolation. If voice input requires offline mode, no score shows it; a project plan with dependencies does.
- Reach dominates: Projects for all users almost always beat specialist features, even when a small group urgently needs them.
- Mandatory stays mandatory: Legal requirements and must-be features sit outside the calculation.
RICE, ICE, MoSCoW or Kano: Which Method Fits When?
RICE fits when you compare many projects with measurable reach and need a ranking. The other three methods answer different questions:
| Method | Key question | Result | Basis |
|---|---|---|---|
| RICE | What delivers the most impact per effort? | Ranking by score | Estimate of four factors |
| ICE | What pays off quickly? | Ranking from impact, confidence and ease | Estimate without reach, ease instead of effort |
| MoSCoW | What must go into this release, what can wait? | Four groups: must, should, could, won’t | Team decision |
| Kano | How does a feature affect satisfaction? | Five categories from must-be to reverse | Survey with question pairs |
In practice, the methods complement each other: Kano separates out must-be features, RICE ranks the remaining projects, and MoSCoW decides what fits the next deadline.
How Do You Apply RICE in Merlin Project?
In Merlin Project, you map RICE with custom fields of type Number and sort the Work Breakdown by score. Custom fields store values; they don’t calculate formulas. So you calculate the score once per project and enter it as a value of its own.
- Create projects as activities: Each project becomes an activity in the Work Breakdown.
- Create four factor fields: Choose Insert > Column, then For new Field, and create the fields “Reach”, “Impact”, “Confidence” and “Effort”. In the column’s inspector, set the Type to Number each time, with the variant Percent for confidence.
- Set the scales: For impact, enter 3, 2, 1, 0.5 and 0.25 under Pre-defined values; for confidence, 100, 80 and 50%. Leave Allow free entry off so everyone uses the same scale.
- Enter the score: Create a fifth field “RICE score” of type Number and enter the result of the formula.
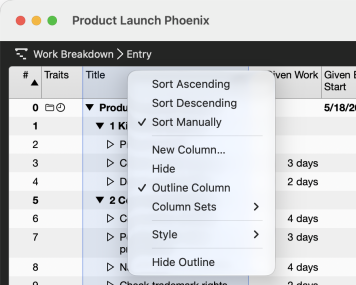
- Sort descending: Control-click the column header “RICE score” and choose Sort Descending. Sort Manually restores the original order.
- Build score bands: A custom grouping by “RICE score” with the option in intervals of 250 bundles projects of similar priority.
Sort by RICE score
The column header’s shortcut menu sorts any column in ascending or descending order, custom fields included. Use New Column to add RICE fields you have already created. Custom fields, filters and groupings are part of Merlin Project, not Merlin Project Express.
Then move the projects with the highest scores into delivery: track their status on the Merlin Project Kanban board, and enter Work and Duration on the inspector’s Plan tab. The estimated effort becomes planned work that you later compare with the actual work.
Conclusion
The RICE score makes prioritization traceable: every number in the formula is open to discussion, and a changed estimate shows its effect on the ranking right away. Stick to the original scales and take must-have features out before scoring.
This article is the second part of our series on prioritization methods. The first part covers the MoSCoW method, the third the Kano model.
If you have any questions about this blog article or would like to discuss it, we look forward to your contribution in our forum.
Frequently asked questions
How do you calculate the RICE score?
Multiply reach, impact and confidence and divide the result by effort. Example: 2,400 users reached per quarter × impact 2 × confidence 80% / 4 person-months gives a RICE score of 960.
What does RICE stand for?
RICE stands for reach, impact, confidence and effort. Sean McBride developed the method as a product manager at Intercom and described it on the Intercom blog.
What is a good RICE score?
There is no absolute threshold. The score depends on the unit of reach, such as users per quarter or transactions per month. Only the ranking within a list scored with the same units and scales is meaningful.
Which impact scale does the RICE method use?
In Intercom’s original: 3 = massive, 2 = high, 1 = medium, 0.5 = low, 0.25 = minimal. Confidence is 100%, 80% or 50%. Scales from 1 to 5 are later variants and shift the weight of the factors.
What is the difference between RICE and ICE?
ICE rates impact, confidence and ease and leaves out reach. Instead of estimating effort in person-months, ICE rates how easy a project is to implement. RICE takes more work but separates projects for many users more clearly from specialist features.