Merlin Project supports various forms of visual project management. Most people have heard of a Gantt chart. The Gantt chart is the most common visual representation for projects. But Merlin Project can do more. Find out exactly what it is and what it's good for in the blog post below.
Why Visual?
Last week you could learn more about Kanban. The Kanban Board is a very good example of visual project management. It is a project board organized by columns on which the work in the project is displayed. Each column represents a work phase in the project. Such a visual project management simplifies the work on projects for all participants. Complexity is reduced to a minimum and the graphical representation makes an abstract issue easier to understand.
Structure Plan
Structure plan, also called WBS (Work-Breakdown-Structure), is one of the best known visual representations of projects.

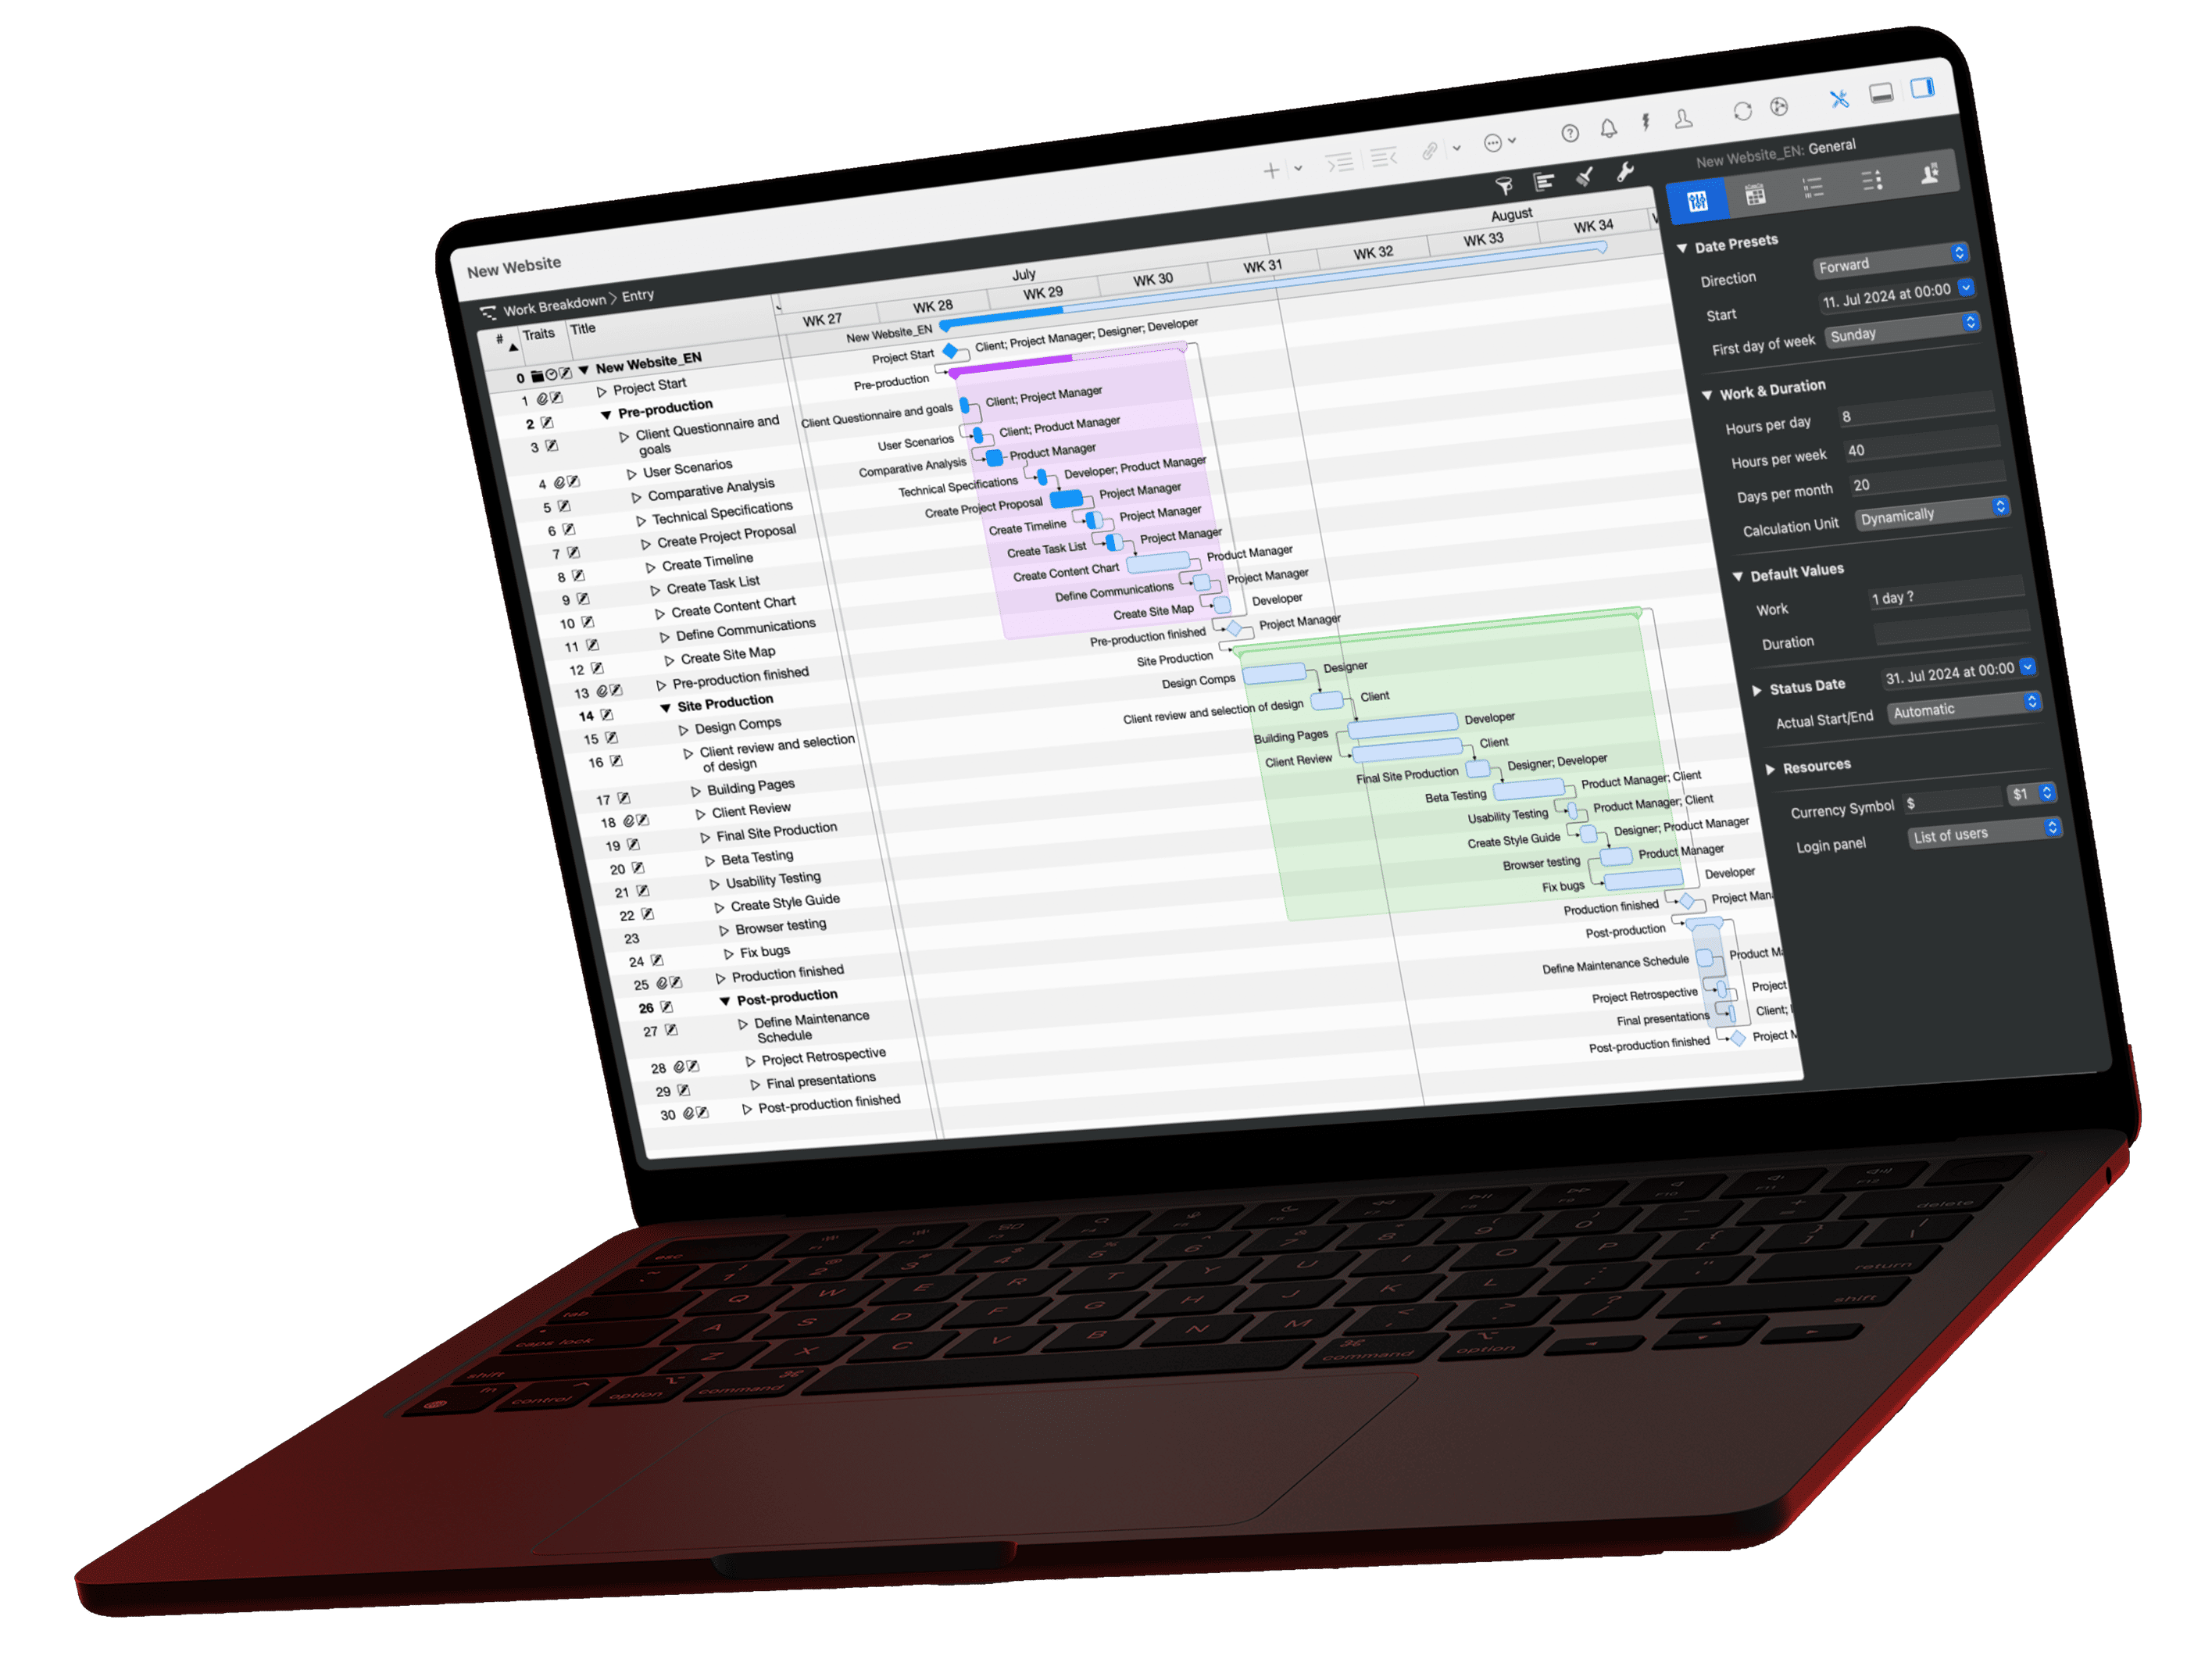
Through the Gantt-Chart or also called bar chart, each project is represented in a simple and clearly understandable way. All information such as duration, work, dependency and much more can be seen directly graphically through shapes and colors. With the zoom function and also the collapse of task groups, project planning can be perfectly mapped thanks to the bars, milestones and dependency arrows.
Net Plan
Under the collective term "Net Plan" or "Network" you will find various graphical representation of a project in Merlin Project. These so called views are:

All of the above, except Kanban, specialize in graphical presentation of the interconnectedness of tasks. They visualize the hierarchies of tasks and thus provide you with a clear overview for planning.
What Are Representations And Views?
The projects and the required tasks to be completed can be represented graphically in different ways. You eat with your eyes and we humans are visual beings. That means we comprehend and implement best what we see. This is true for both simple and complex issues.
In project management, visualization is a main component of the entire concept. With the Gantt chart a well-tried representation for project management is available. With the help of bars, milestones and linking lines the course of the project is graphically displayed in a timeline with all its tasks, time dependencies, sequences, and achieved states and thus visualized in a simple and understandable way.
With the Gantt chart, you have one of the most common project management representations available to your team and all project participants.

The Gantt view is only one of many that Merlin Project offers. Once you have created a project in Merlin Project, you can display it in different views at any time and as often as you like. Depending on your needs, it can be visualized into a mind map, kanban or network diagram.
What Makes Visualization So Important?
The advantages of visualization are obvious. Any project can be visualized according to globally recognized and well-known graphical representations. It can thus be read graphically by project managers and all project participants. In case of questions and planning meetings, it serves as a template for further processing and enables a quick identification of planning conflicts during the entire planning process.
If you as a project manager know which views you need for current and future projects in your company, you will be able to plan particularly efficiently and well. This allows you to always visually represent the available projects according to the requirements.
With the "Mind-Map" view, for example, new projects can be structured particularly well in the preparation phase and important aspects can be recorded for the planning phase.

Another aspect of visual project management is the fact that the progress of the project can be seen very well in various graphical representations. This information helps you to keep track of the current and future situation in the project. Delays and other problems are prevented in time by appropriate countermeasures and solutions.
The Advantages Of Visualization
Below are some important benefits of visualization in project management:
-
More planning reliability: By visualizing projects graphically, you maintain an overview, miss less and be able to focus on the project work better.
-
Good understanding: Good visualization makes projects more comprehensible, transparent and effective. This improves the understanding of the project by all parties involved and prevents possible misunderstandings during communication.
-
Good documentation: If your project is delayed or even fails due to problems, you will have proper proof through a good graphical representation. With the representation in place, you have captured the information and better recognize the consequences of the problems that have arisen.
This gives you a "lessons learned" argument for future projects.
Did you know that you can use styles to graphically customize the displays for your projects? Learn more here.
Conclusion
Visualization plays an immense role in your projects. With the overview of existing projects you can see a variety of important aspects, such as the work, dependencies, resources, problems and time as well as the costs for your project.
The presentation allows you to get a good overview of the entire contents of the project, for example, to determine possible cost or time factors in the course of the project.
We hope you enjoy using Merlin Project and appreciate every good review!
If you have any questions about this blog article or would like to discuss it, we look forward to your contribution in our forum.