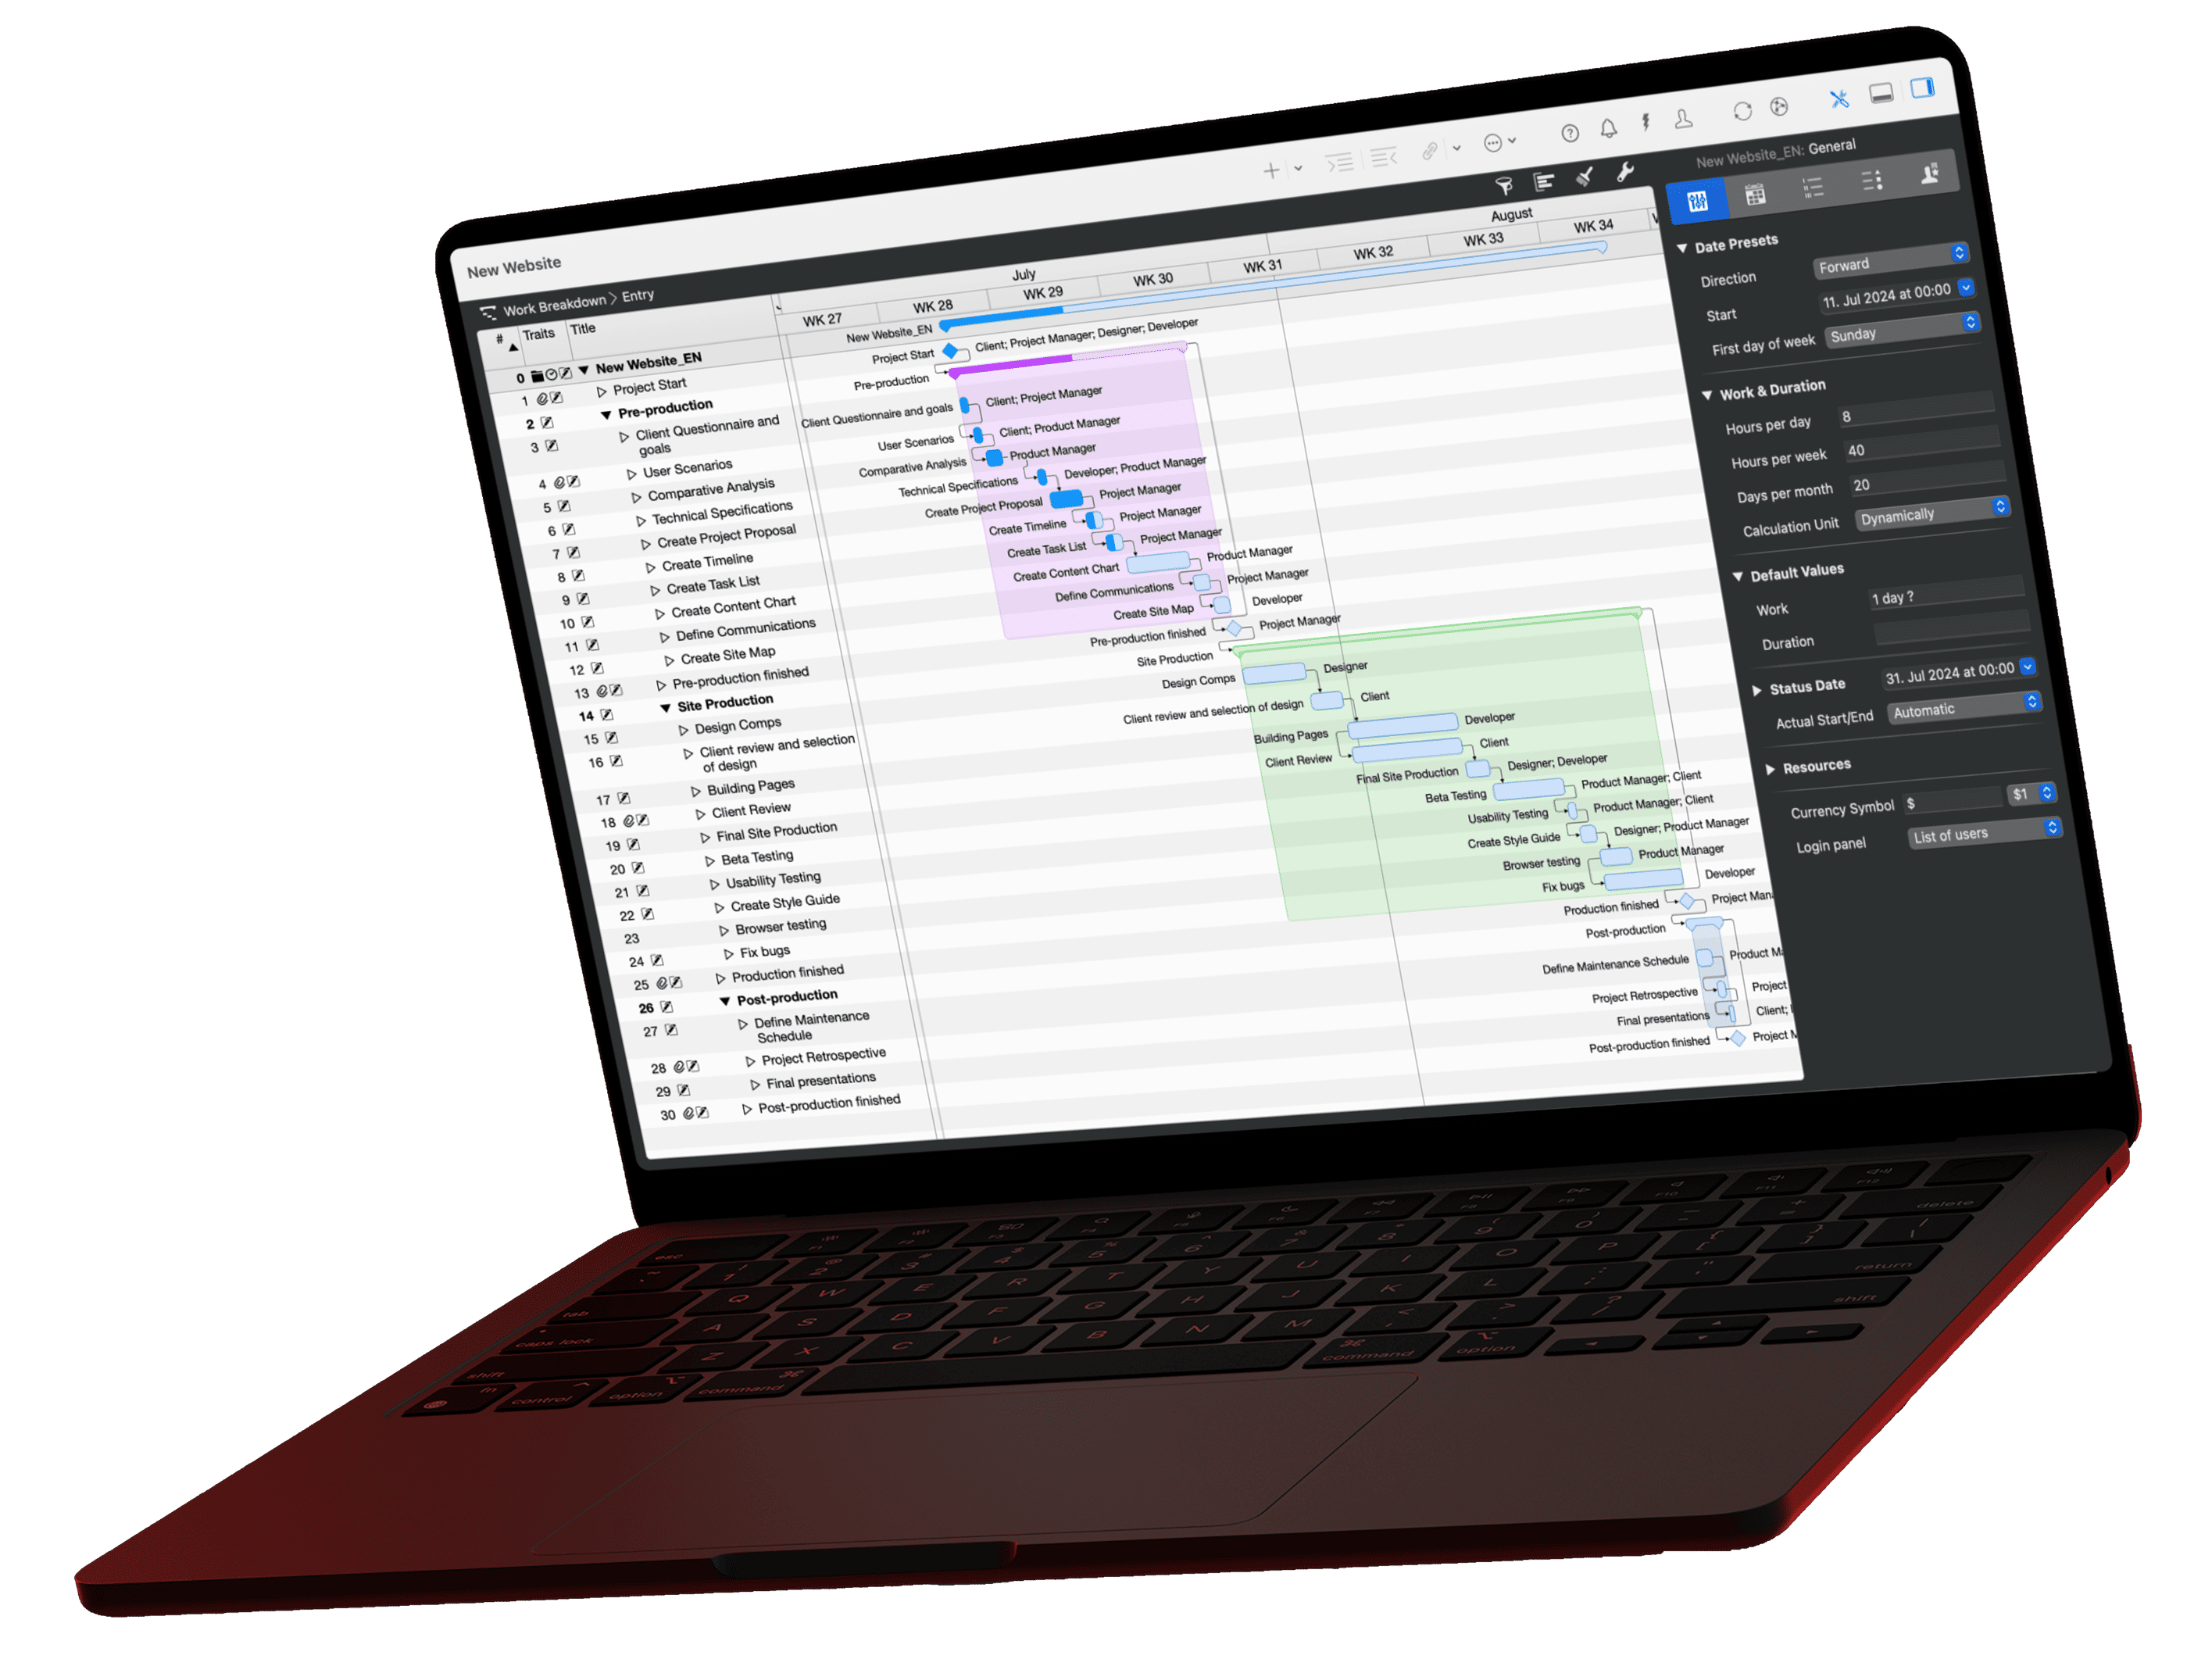
The Pareto principle, also called the 80/20 rule, describes an uneven distribution: a few causes account for most of the effects, as a rule of thumb 20% of causes for about 80% of effects. Vilfredo Pareto found the pattern in the distribution of wealth in Italy. Joseph M. Juran applied it to quality management from the 1940s and gave it its name.
What does the Pareto principle say?
The Pareto principle says that effects are almost never spread evenly across their causes: a small group of causes, customers, defects or tasks produces most of the result. The figure 80/20 is shorthand for this pattern; you measure the real values in your own project.
Three points make the rule precise:
- It is an empirical rule of thumb. The distribution comes from data you collect in your own project. In one case 20% of causes account for 80% of the effect, in the next 30% for 65% or 10% for 90%.
- The two numbers do not have to add up to 100. 20% describes a share of causes, 80% a share of effects. They measure different things. In 2002, Microsoft CEO Steve Ballmer wrote after analyzing error reports that about 20% of bugs caused 80% of all errors and 1% of bugs caused half of them (Ballmer memo, October 2002).
- The rule links causes to effects. The popular phrase "80% of the results come from 20% of the effort" is a special case. It only holds if your data show that effort is distributed that way. The rule tells you where to look first. The important 20% still need your full commitment.
Where does the Pareto principle come from?

The Pareto principle goes back to two people: the economist Vilfredo Pareto, who described the unequal distribution of wealth, and the quality expert Joseph M. Juran, who turned it into a general management principle and named it after Pareto.
Vilfredo Pareto (1848 to 1923) taught economics at the University of Lausanne. In his textbooks, the Cours d'économie politique (1896/97) and the Manuale di economia politica (1906), he studied the distribution of income and wealth. The well-known short form: in Italy, about 20% of the population owned about 80% of the land (Wikipedia: Pareto principle). Pareto himself applied his observation to economics only.
Joseph M. Juran (1904 to 2008) came across Pareto's models during a visit to General Motors in the late 1930s. In the Quality Control Handbook (first edition, 1951) he showed that quality losses are as unevenly distributed as wealth and called the pattern the "Pareto principle". He also coined the phrase "the vital few and the trivial many". Later he replaced "trivial" with "useful", because the remaining 80% still need work. In 1974, Juran admitted that naming it after Pareto was a mistake: Pareto never generalized the pattern, and the cumulative curves go back to the statistician Max O. Lorenz (Juran: The Non-Pareto Principle, 1974). The name stuck anyway.
Juran made the principle a tool of quality management: if you fix the few defect types with the largest losses first, you get the biggest improvement from limited resources.
What is a Pareto analysis?
A Pareto analysis ranks causes by frequency or weight in descending order, calculates the cumulative share for each and shows the result as a Pareto chart of bars and a cumulative line. This tells you which few causes to tackle first.
You work in five steps:
- Define the effect: What do you measure? For example, disruptions that delayed the schedule, defects at handover or cost overruns.
- Categorize the causes: Define five to ten clearly separated categories and assign each event to exactly one.
- Count and sort: Count the events per category and sort in descending order.
- Accumulate: Divide each count by the total and add the shares from top to bottom.
- Draw the line: The categories up to about 80% cumulative share are your "vital few". Plan measures for them first.
How do I apply the 80/20 rule in a construction project?
You apply the 80/20 rule by analyzing real project data: count causes, sort them in descending order and calculate the cumulative share. The following worked example shows a Pareto analysis of the causes of delay in a construction project.
An architecture firm manages the construction of an apartment building with 18 units. The site management recorded every disruption that delayed an activity as an issue on the affected activity and assigned it to a cause. After the shell and interior work, there are 120 entries in seven categories. The figures are a constructed example.
| Rank | Cause | Count | Share | Cumulative |
|---|---|---|---|---|
| 1 | Late material delivery | 46 | 38.3% | 38.3% |
| 2 | Design change by client | 33 | 27.5% | 65.8% |
| 3 | Missing approval | 15 | 12.5% | 78.3% |
| 4 | Weather | 10 | 8.3% | 86.7% |
| 5 | Subcontractor no-show | 8 | 6.7% | 93.3% |
| 6 | Defect rework | 5 | 4.2% | 97.5% |
| 7 | Authority requirement | 3 | 2.5% | 100.0% |
| Total | 120 | 100% |
Pareto chart: causes of delay in a construction project
120 recorded disruptions, sorted in descending order, with cumulative share
How to read the result:
- The two largest causes, late deliveries and design changes, are 2 of 7 categories (28.6%) and explain 79 of 120 disruptions (65.8%).
- Three causes reach 78.3%. In this project the distribution is roughly 43/78. That is the normal case: the exact shares depend on the project.
- Measures for the "vital few": Set order dates as milestones with a buffer before installation. Agree on decision deadlines per project phase with the client, so design changes arrive earlier. Give approvals their own activities in the schedule.
- Keep an eye on the "useful many": Weather or authority requirements occur less often but can cost more in a single case. Also count days of delay or costs per cause when you make budget decisions.
How do I run a Pareto analysis in Merlin Project?
In Merlin Project, you record each disruption as an attachment of the type Issue directly on the affected activity, assign it a Category and evaluate the issues grouped in the Attachments view. You transfer the count per group to the Pareto table.
- Record the issue: Select the delayed activity and choose Insert > Attachment > Issue. In the Inspector, fill in Reported by, Assigned to and Fix until.
- Create causes as categories: The Category field comes with the values General, Technical, Employees, Financial and Environment. Adapt the list to your causes in the project settings under Value Lists, for example "Late material delivery" or "Design change by client".
- Filter issues: Open the Attachments view and choose Issues in the filter drop-down.
- Group by cause: Open the groupings in Merlin Project, create your own grouping with + and under Group choose the field Category after by. Count the entries per group and sort the groups in descending order.
- Turn causes into risks: For the two or three largest causes, add an attachment of the type Risk with probability and countermeasure to the upcoming construction phases. This links the analysis to risk management.
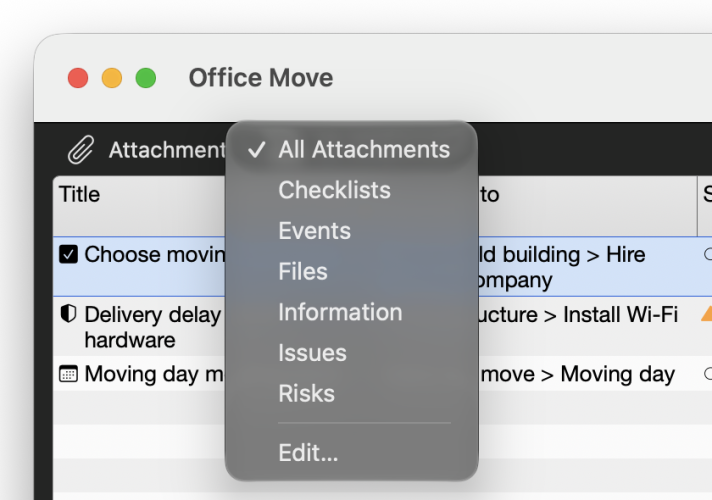
Filtering issues in Merlin Project
The Attachments view collects all issues, risks and checklists of a project in one table. With the Issues filter you see only the recorded disruptions and jump to the related activity from the context menu. How the six attachment types work together is shown in attachments in Merlin Project and in the lesson Managing attachments.
Where does the 80/20 rule help in project management?
The 80/20 rule helps in every project phase where you decide where to direct limited time and budget first. The guiding question is always: which few elements determine most of the result?
Initiation
Find out which stakeholders, requirements or risks carry the most weight. If a few stakeholders influence most decisions, involve them closely from the start.
Planning
Check which work packages carry most of the cost, duration or project value. Estimate these packages most carefully and give them a buffer and a contingency plan. For detailed prioritization, the four-quadrant priority matrix and the MoSCoW method complement the analysis.
Execution
Analyze issues and disruptions continuously, as in the construction project above. As soon as one cause piles up, act before it hits the critical path.
Monitoring and controlling
Limit your reporting to the few indicators that show the project status best, such as critical milestones, cost variance and the largest open risks.
Closing
Use the Pareto analysis for your lessons learned: which few causes created most of the problems, and what will you change in the next project?
How do I use the 80/20 rule for time management?
In time management, you use the 80/20 rule by checking which few tasks contribute most to your goals and giving those tasks fixed time in your calendar. You determine the distribution from your own work, for example from one week of time tracking.
For one week, write down what you work on and what result it produces. Then mark the tasks that really move projects forward. Put these tasks into protected time blocks; our guide to time blocking with a sample daily schedule shows what that looks like. Bundle routine work such as email or administration in fixed blocks instead of dropping it.
What are the limits of the Pareto principle?
The Pareto principle has limits because it is only as good as the data and categories behind it. It shows you where to look first and does not replace an assessment of damage, cost and dependencies.
| Strengths | Limits |
|---|---|
| Directs scarce time and budget to the largest causes | Only applies to the data you measured; without counting, 80/20 remains a guess |
| Makes priorities traceable for the team with numbers | Frequency says nothing about severity: rare causes can cost more |
| Works with simple means: count, sort, accumulate | Categories that are too coarse or too fine distort the result |
| Provides a basis for lessons learned and risk management | Tempts you to neglect the "useful many", although they still need to be done |
If you have any questions about this blog article or would like to discuss it, we look forward to your contribution in our forum.
Frequently asked questions
What is the 80/20 rule in simple terms?
The 80/20 rule says that a few causes produce most of the effects. As a rule of thumb, about 20% of causes account for about 80% of effects. You determine the exact values from your own data.
Is 80% of the work done by 20% of the people?
Sometimes, but the 80/20 rule does not guarantee it. The principle only states that results are distributed unevenly. Whether 20% of a team deliver 80% of the output, you can only tell from measured data such as completed activities or hours. The split can just as well be 30/70 or 10/60.
Do the numbers in the Pareto principle have to add up to 100?
No. The 20% refers to causes, the 80% to effects. Because the two numbers measure different things, splits such as 10/90, 30/65 or 1/50 are also possible.
Does the 80/20 rule appear in PMP preparation?
Yes, in quality management. PMP study guides list the Pareto chart among the seven basic quality tools. It ranks problems by frequency in descending order so that the team addresses the most frequent causes first.
Who invented the Pareto principle?
The economist Vilfredo Pareto observed the unequal distribution of wealth. The name "Pareto principle" and its generalization to other fields come from the quality expert Joseph M. Juran in the Quality Control Handbook of 1951.