Creating and Customizing Reports
Reports are a powerful way to gain insights into your project's data and share information with stakeholders. Merlin Project provides a variety of pre-installed reports to help you get started, but you can also create and customize your own reports to suit your specific needs.
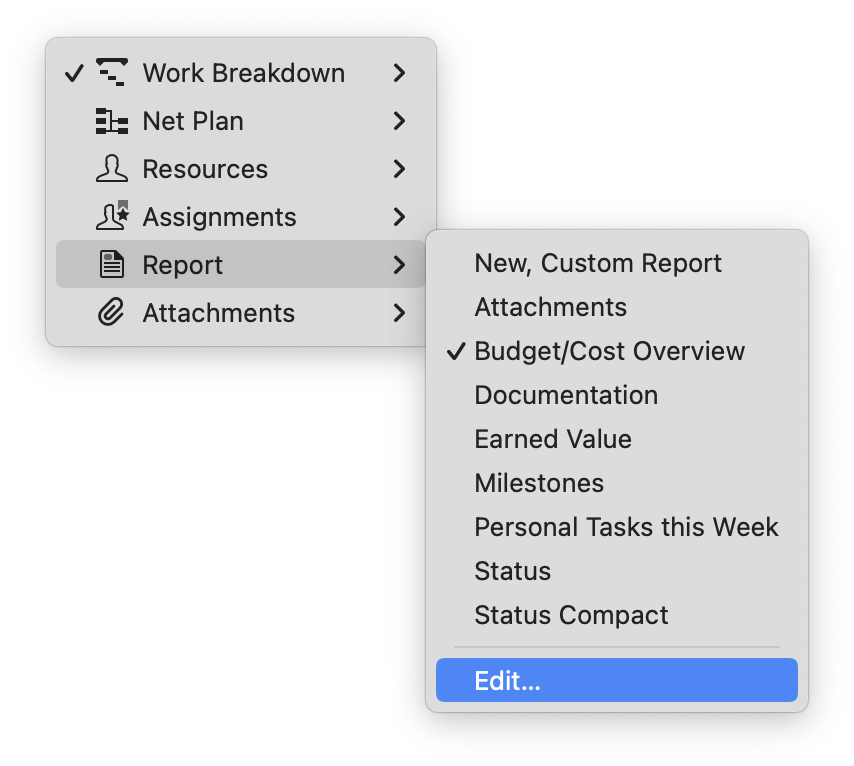
Click on the "Report" view type on the left side of the Function Bar. You'll find a first selection of built-in reports that you can use. However, for now, we want to create our own report.

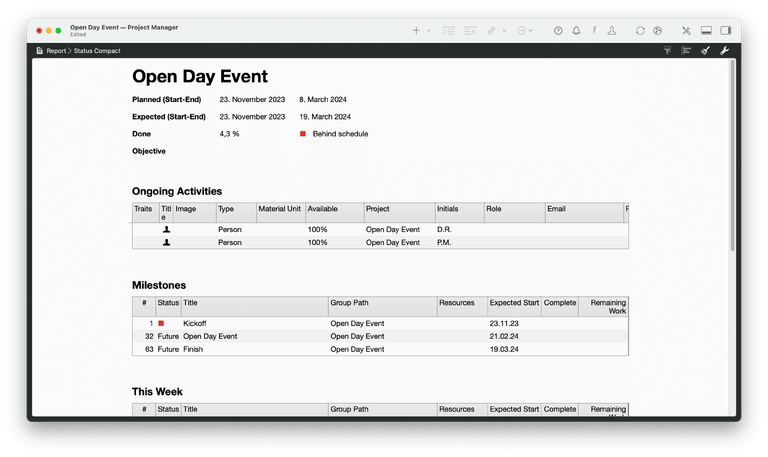
In general, please note that the appearance of reports depends on the predefined paper size. Reports are composed of various modules that gather information from different project views.
Here's how to work with report modules:
- Customise or remove report modules from the page
You can customize existing reports by selecting a module within the report and opening the Inspector. If you want to move the module up or down, go to the menu "Structure" > "Move Up" / "Move Down" or press ⌃+⌘+↑ / ⌃+⌘+↓. You can delete existing modules with the delete button.

- Add modules to the report
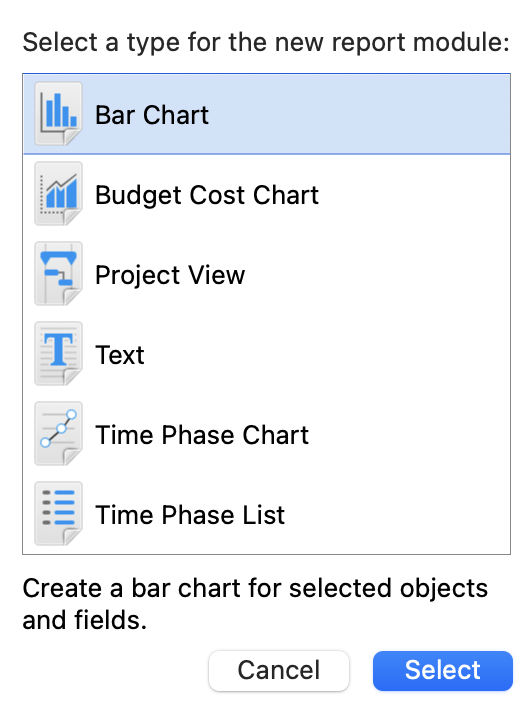
To add a new module, click on the plus symbol in the Tool Bar or press ⌘+N. You can select from the following module types:
- Bar Chart
- Budget Cost Chart
- Project View
- Text
- Time Phases Chart
- Time Phases List
Bar Chart: The Bar Chart module offers various options for creating bar charts in your report. You can define filters to determine which objects appear in the chart and customize its appearance.
Budget Cost Chart: This module allows you to add budget columns to a report, making it suitable for reports containing cost information.
Project View: The Project View module is versatile and commonly used. It lets you import any type (Work Breakdown, Net Plan, Resources, Assignments, Attachments) and respective view per type directly into the module.
Text: Use the Text module to insert static text into your report.
Time Phases Chart: Create line charts from time phase values using this module. Define the sample rate to determine the length of time phases for the chart.
Time Phases List: This module generates a table from time phase values of selected fields. The settings for the Time Phases List are the same as for the Time Phases Chart, but it doesn't provide a graphical representation.

- Adapt modules within the report
Click on the modules in the Reports view to adjust them in the Inspector. Based on the view type and module selected, you'll have plenty of options to create, filter, and group the content. This allows you to tailor the report specifically to your audience.
Now that you know how to create and customize reports, you can use this knowledge to generate tailored reports in Merlin Project. In the next chapter, we will explore how to export and share these reports effectively.
We’re happy to refer you to our partners. They offer dedicated Merlin trainings for any topic and support rolling out Merlin across your projects.
We recommend: Gareth Watson, certified Merlin Project Trainer (online & inhouse)
Do you have questions or want to connect with us on social media? Then click on the buttons below.

 E-mail
  Linkedin