General
Bubble-Chart
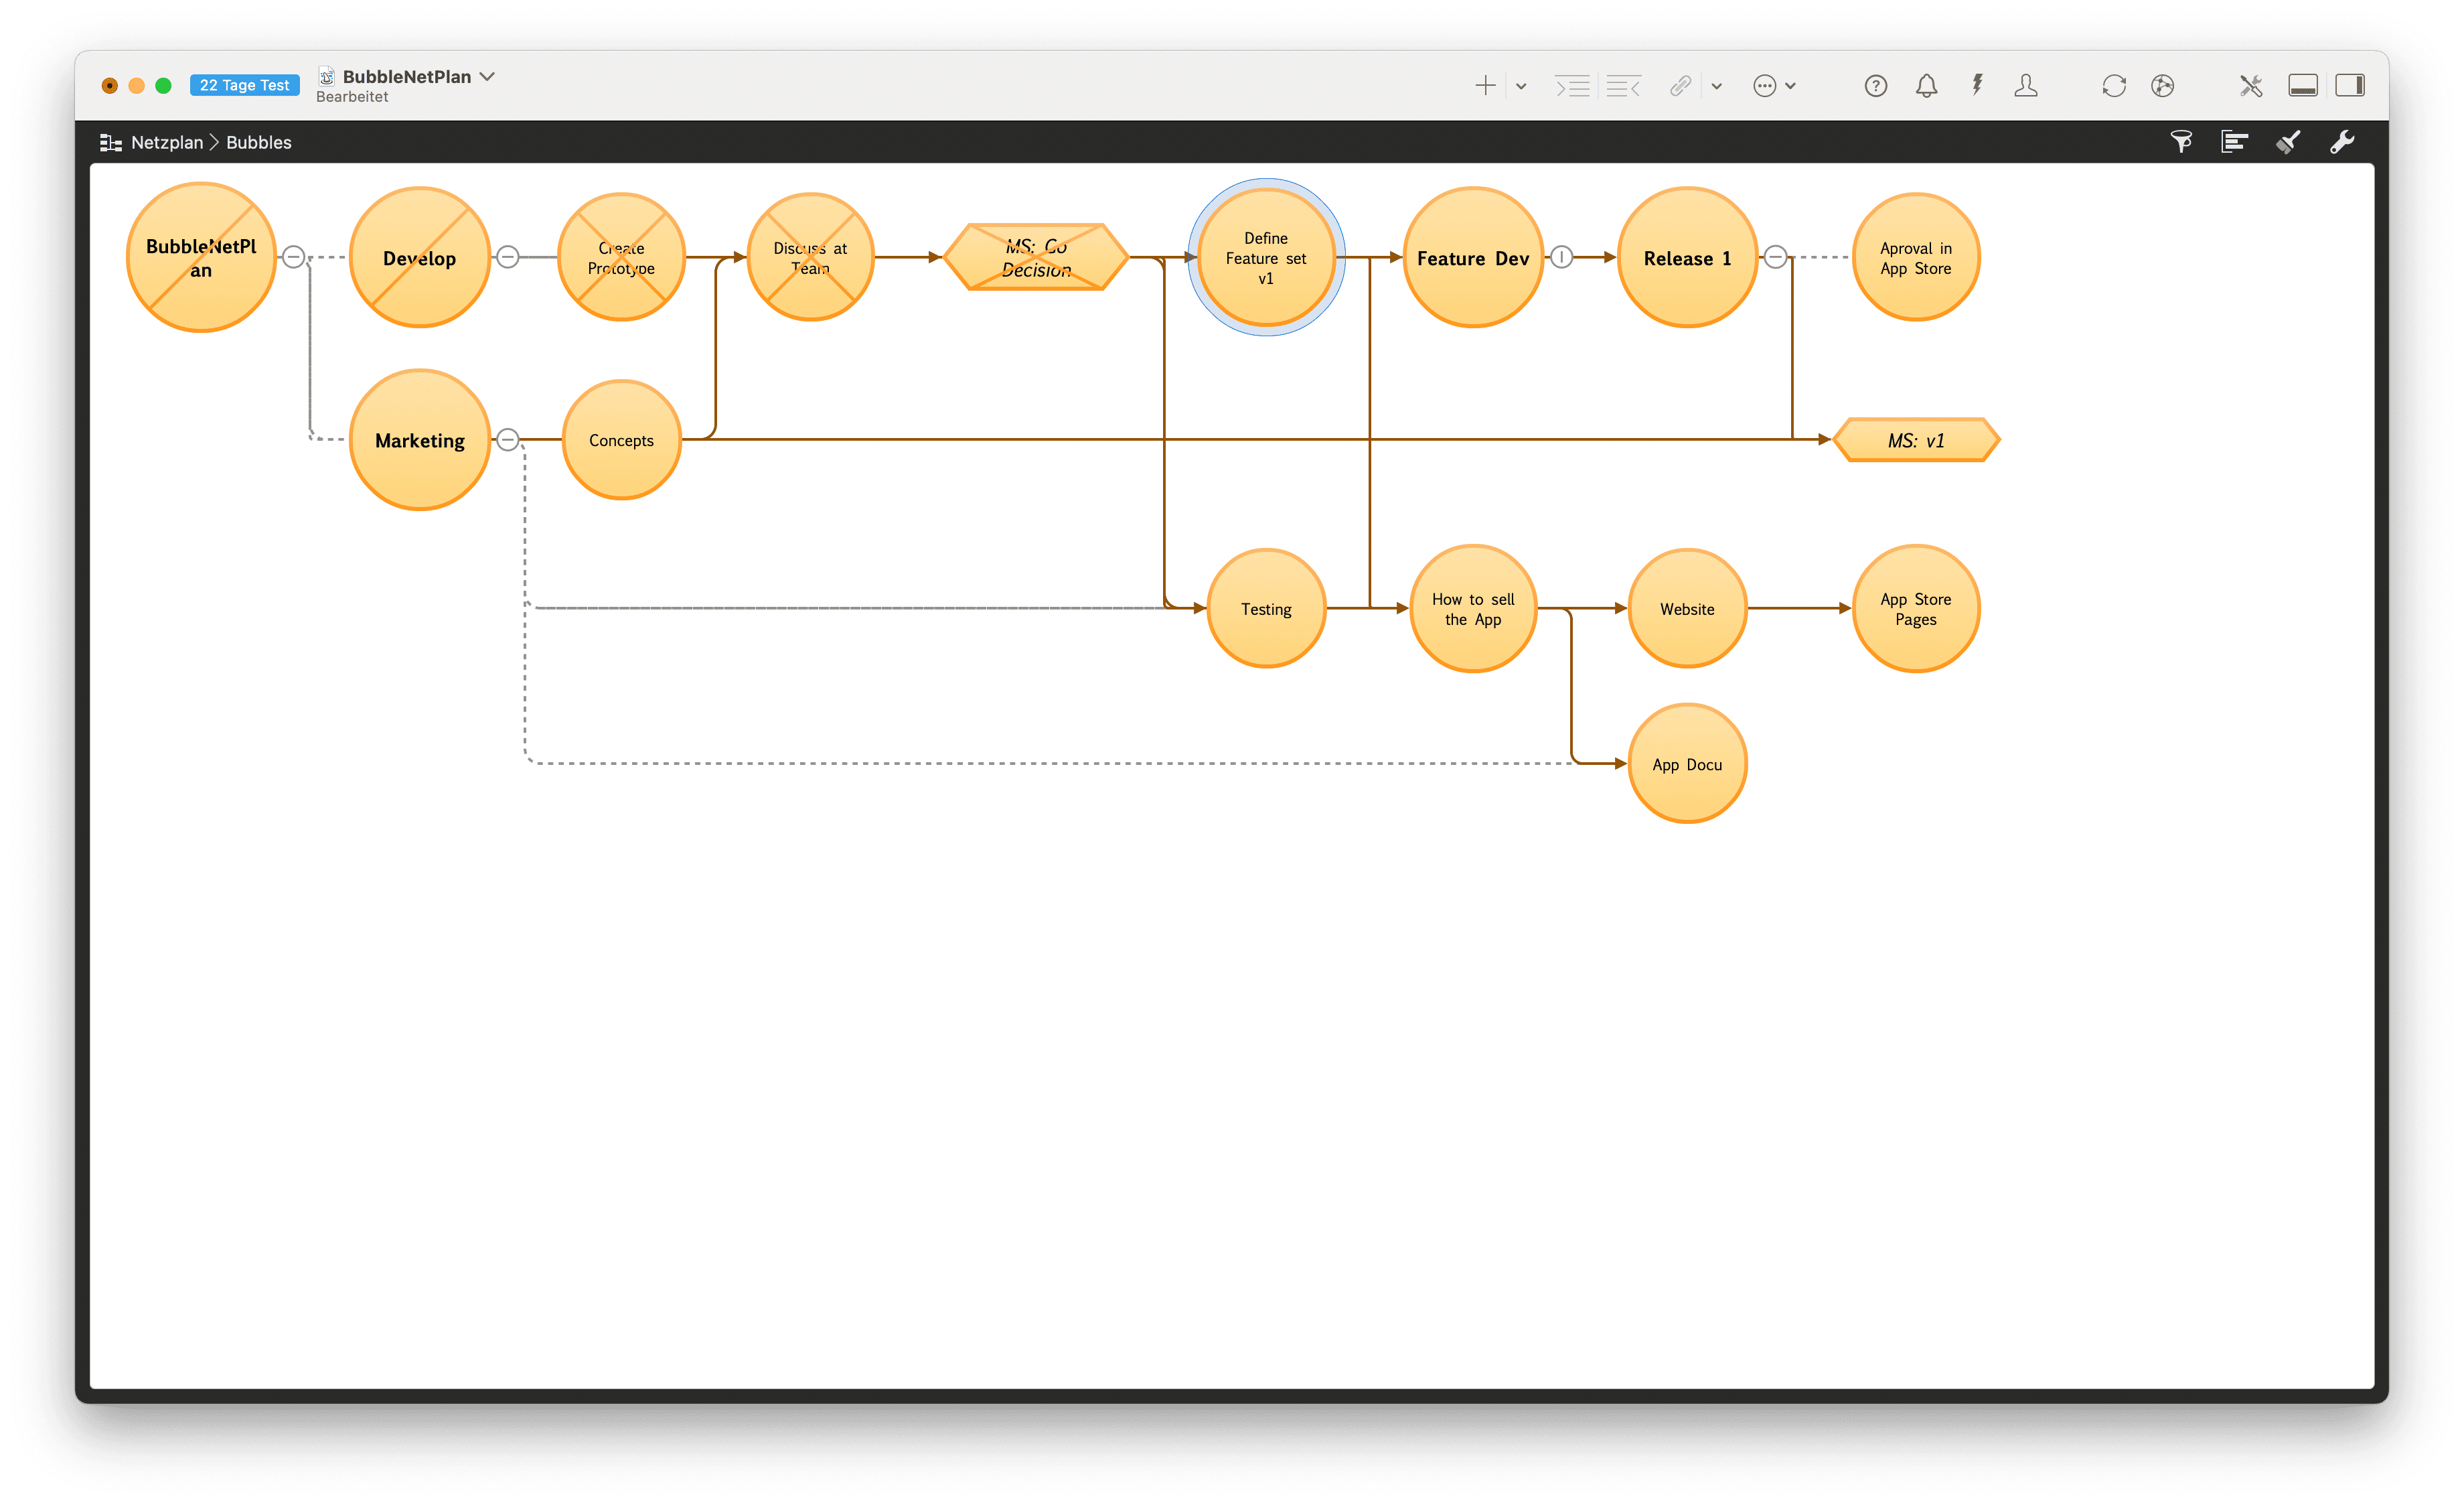
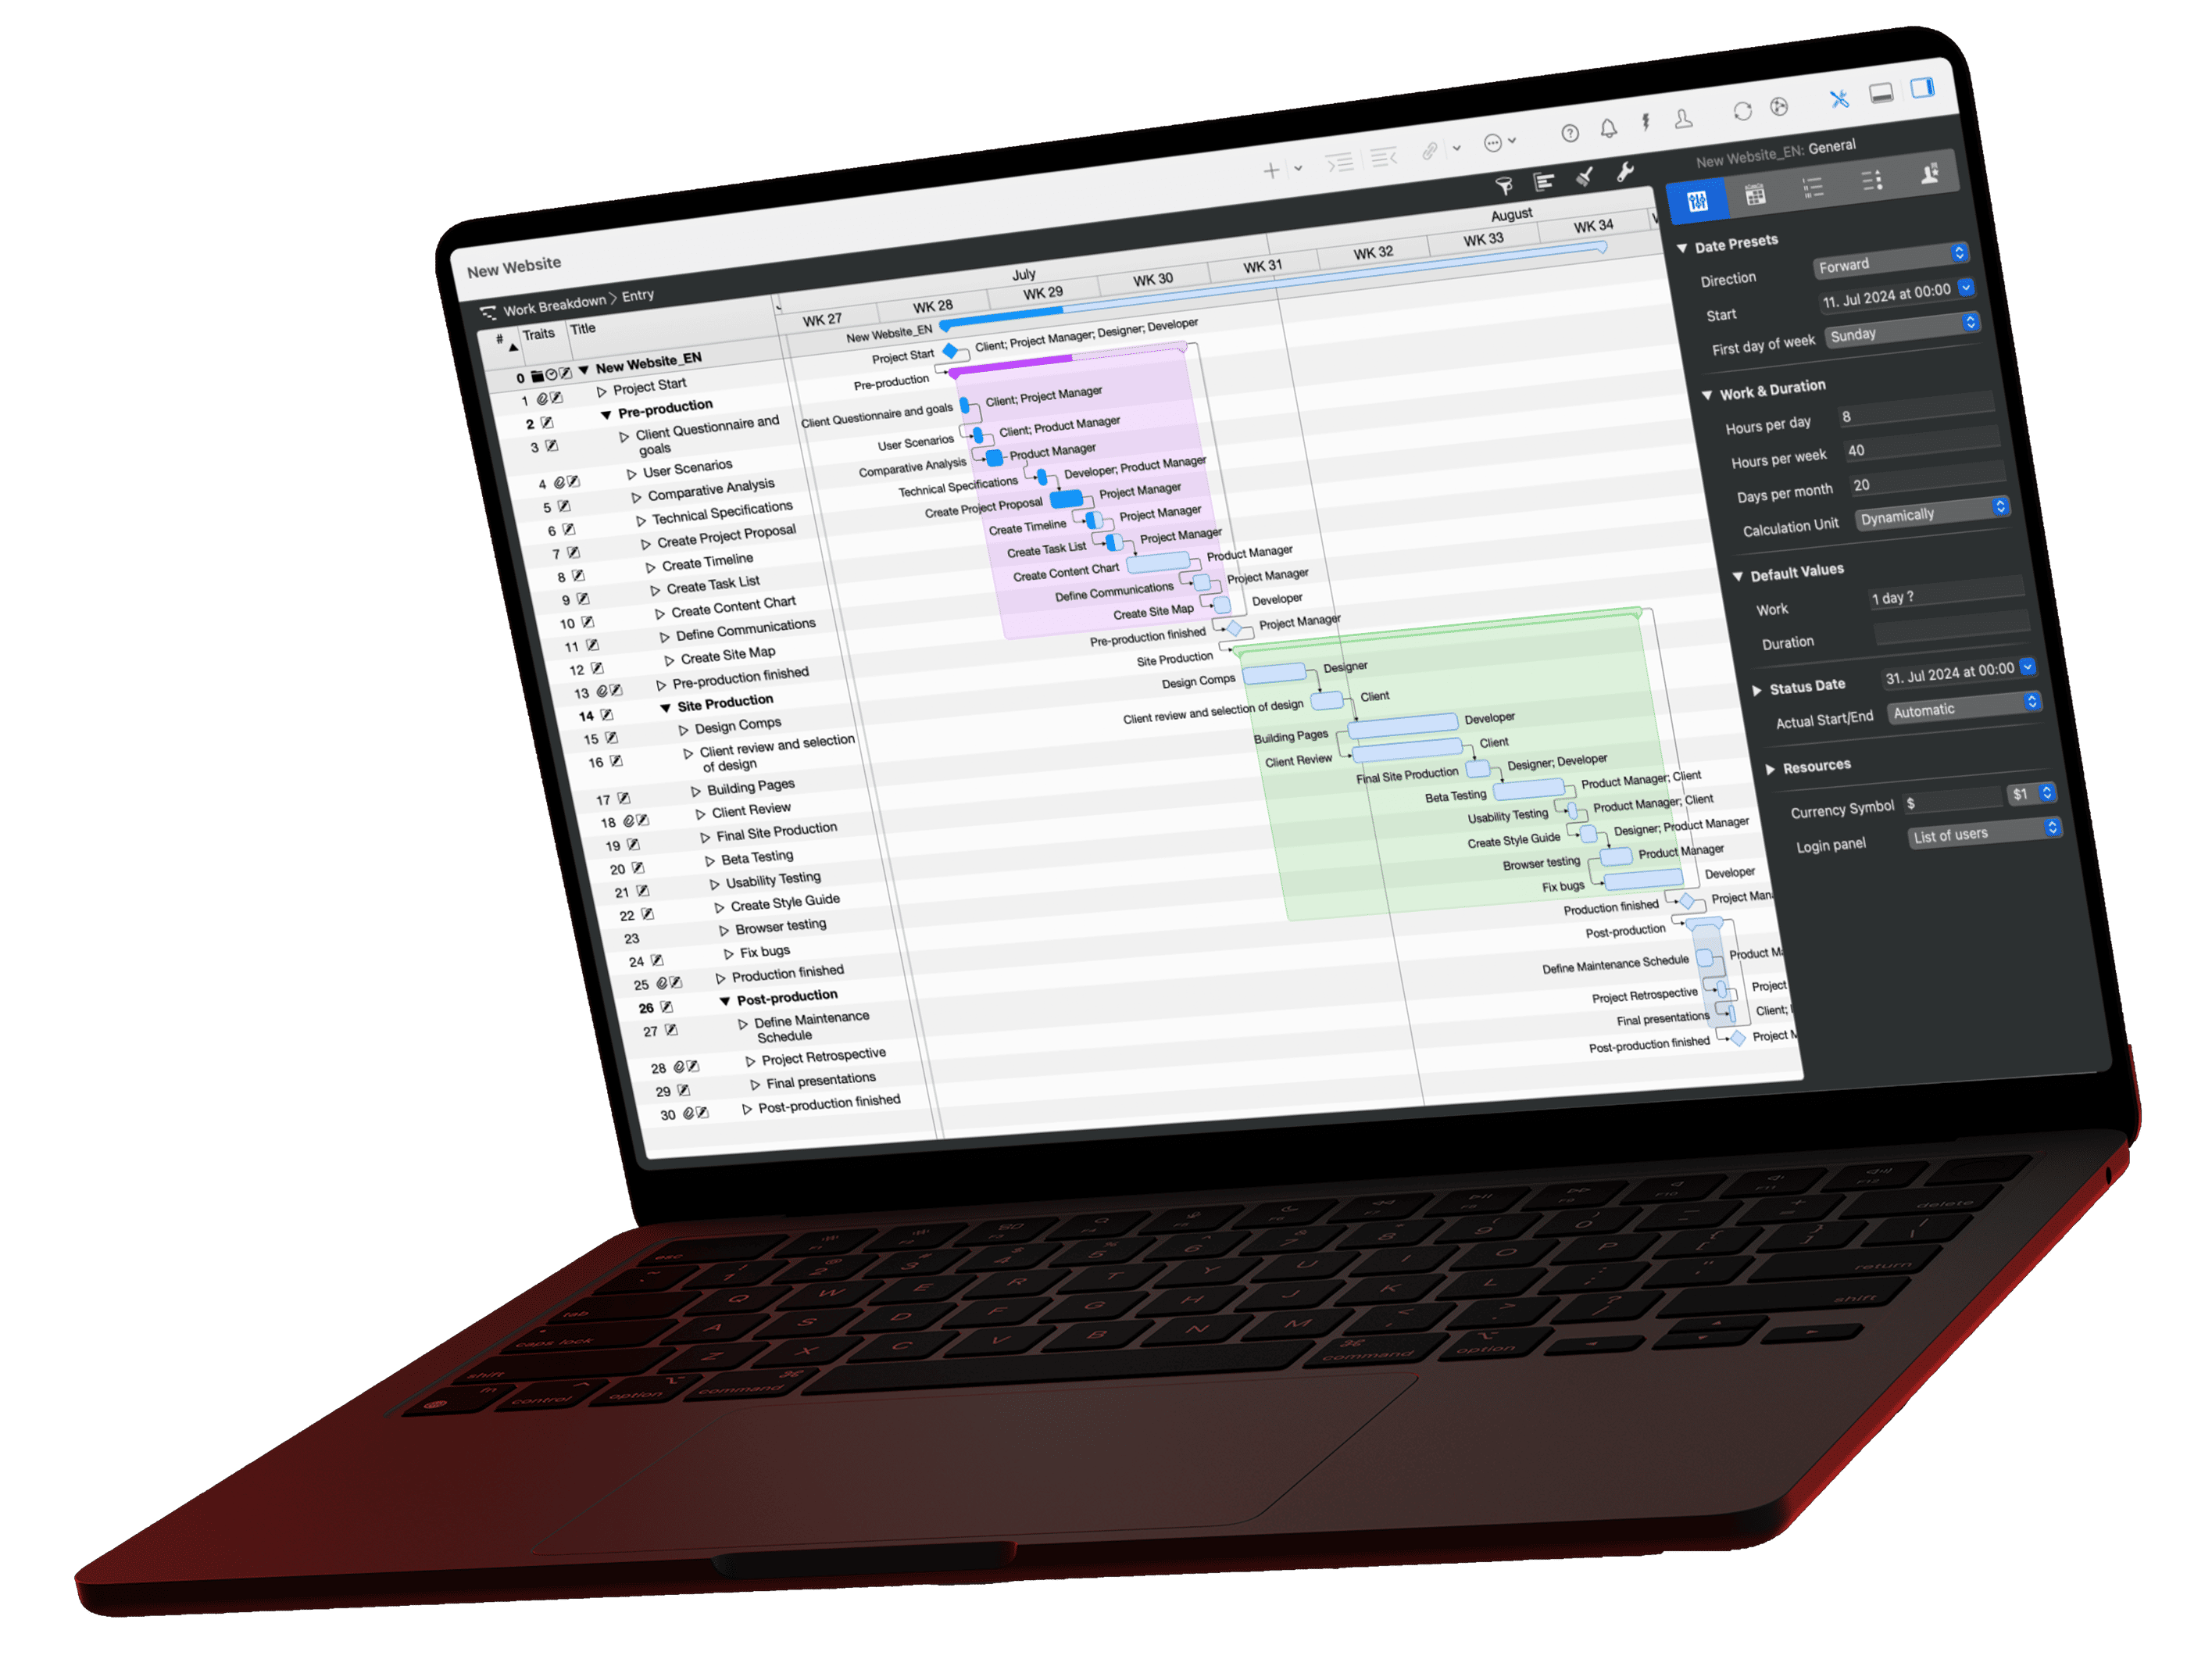
With the "Bubbles" network view, you can display a project plan as a process chart. Thus
complex projects are displayed very compactly within seconds. The detailed planning is contained in the same document and is therefore always at hand. It is even possible to display both at the same time via the detail view.
Sprachen: 🇩🇪🇺🇸🇪🇸🇫🇷