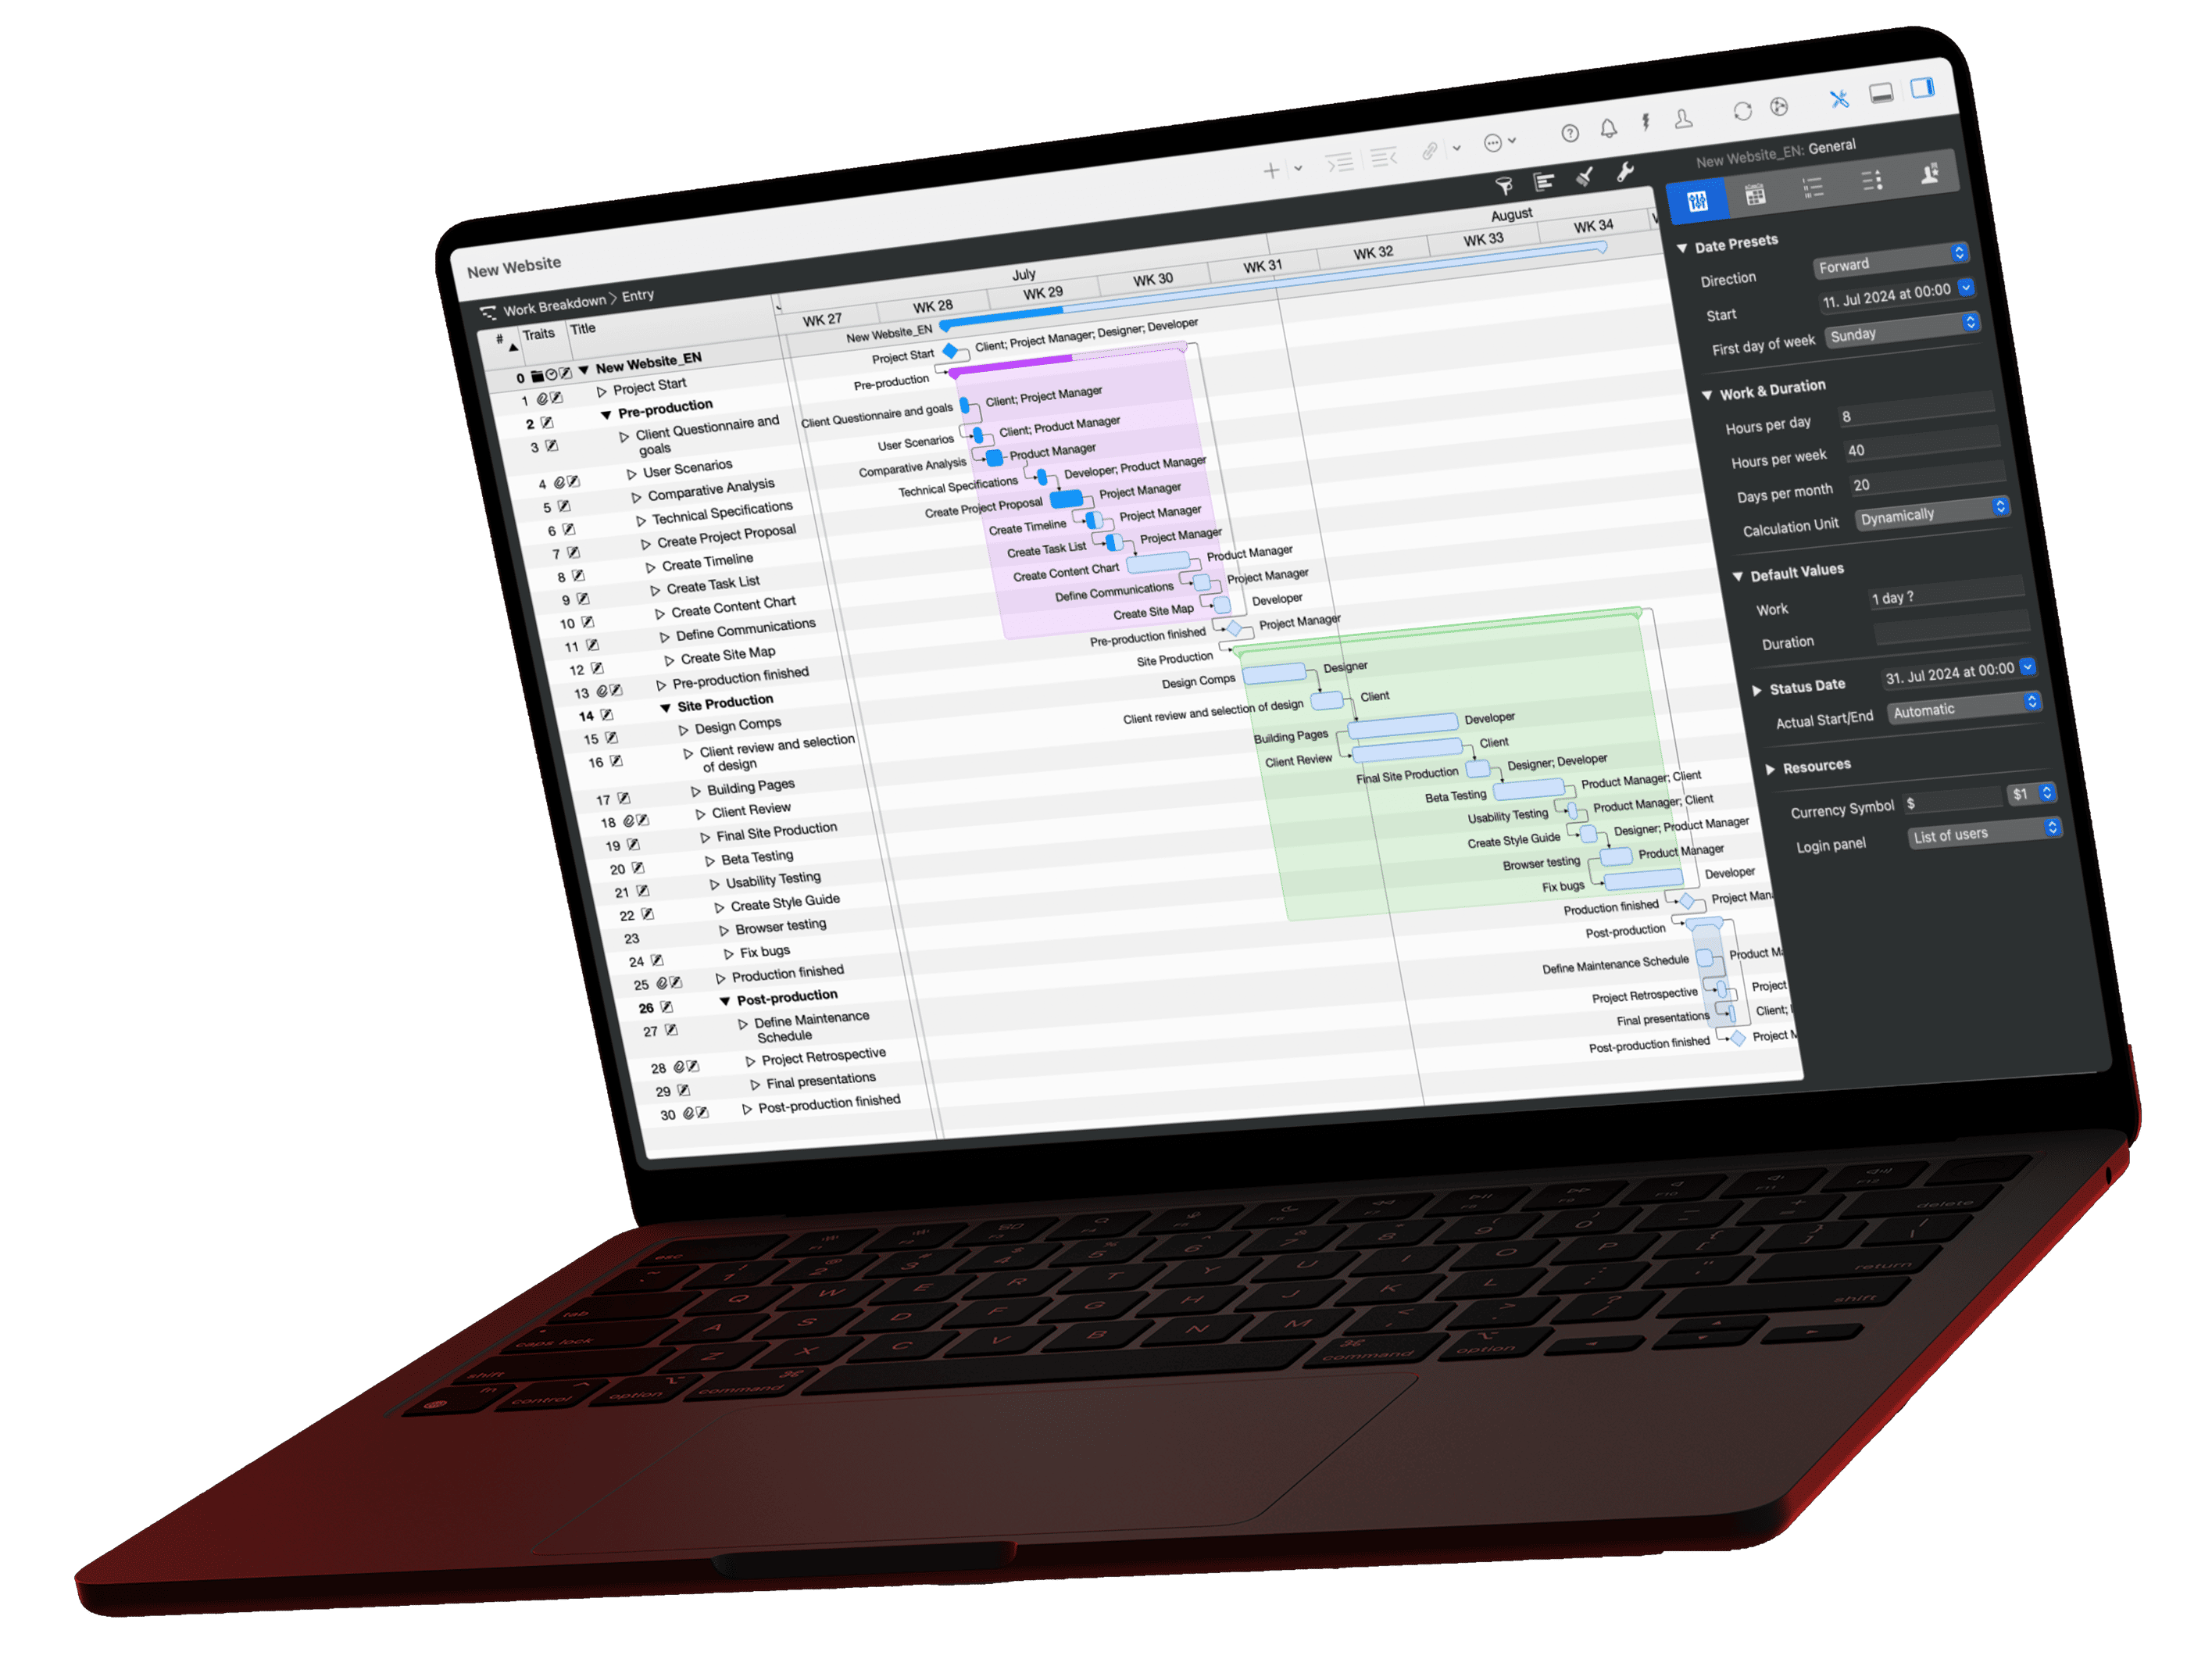
Special Design Options
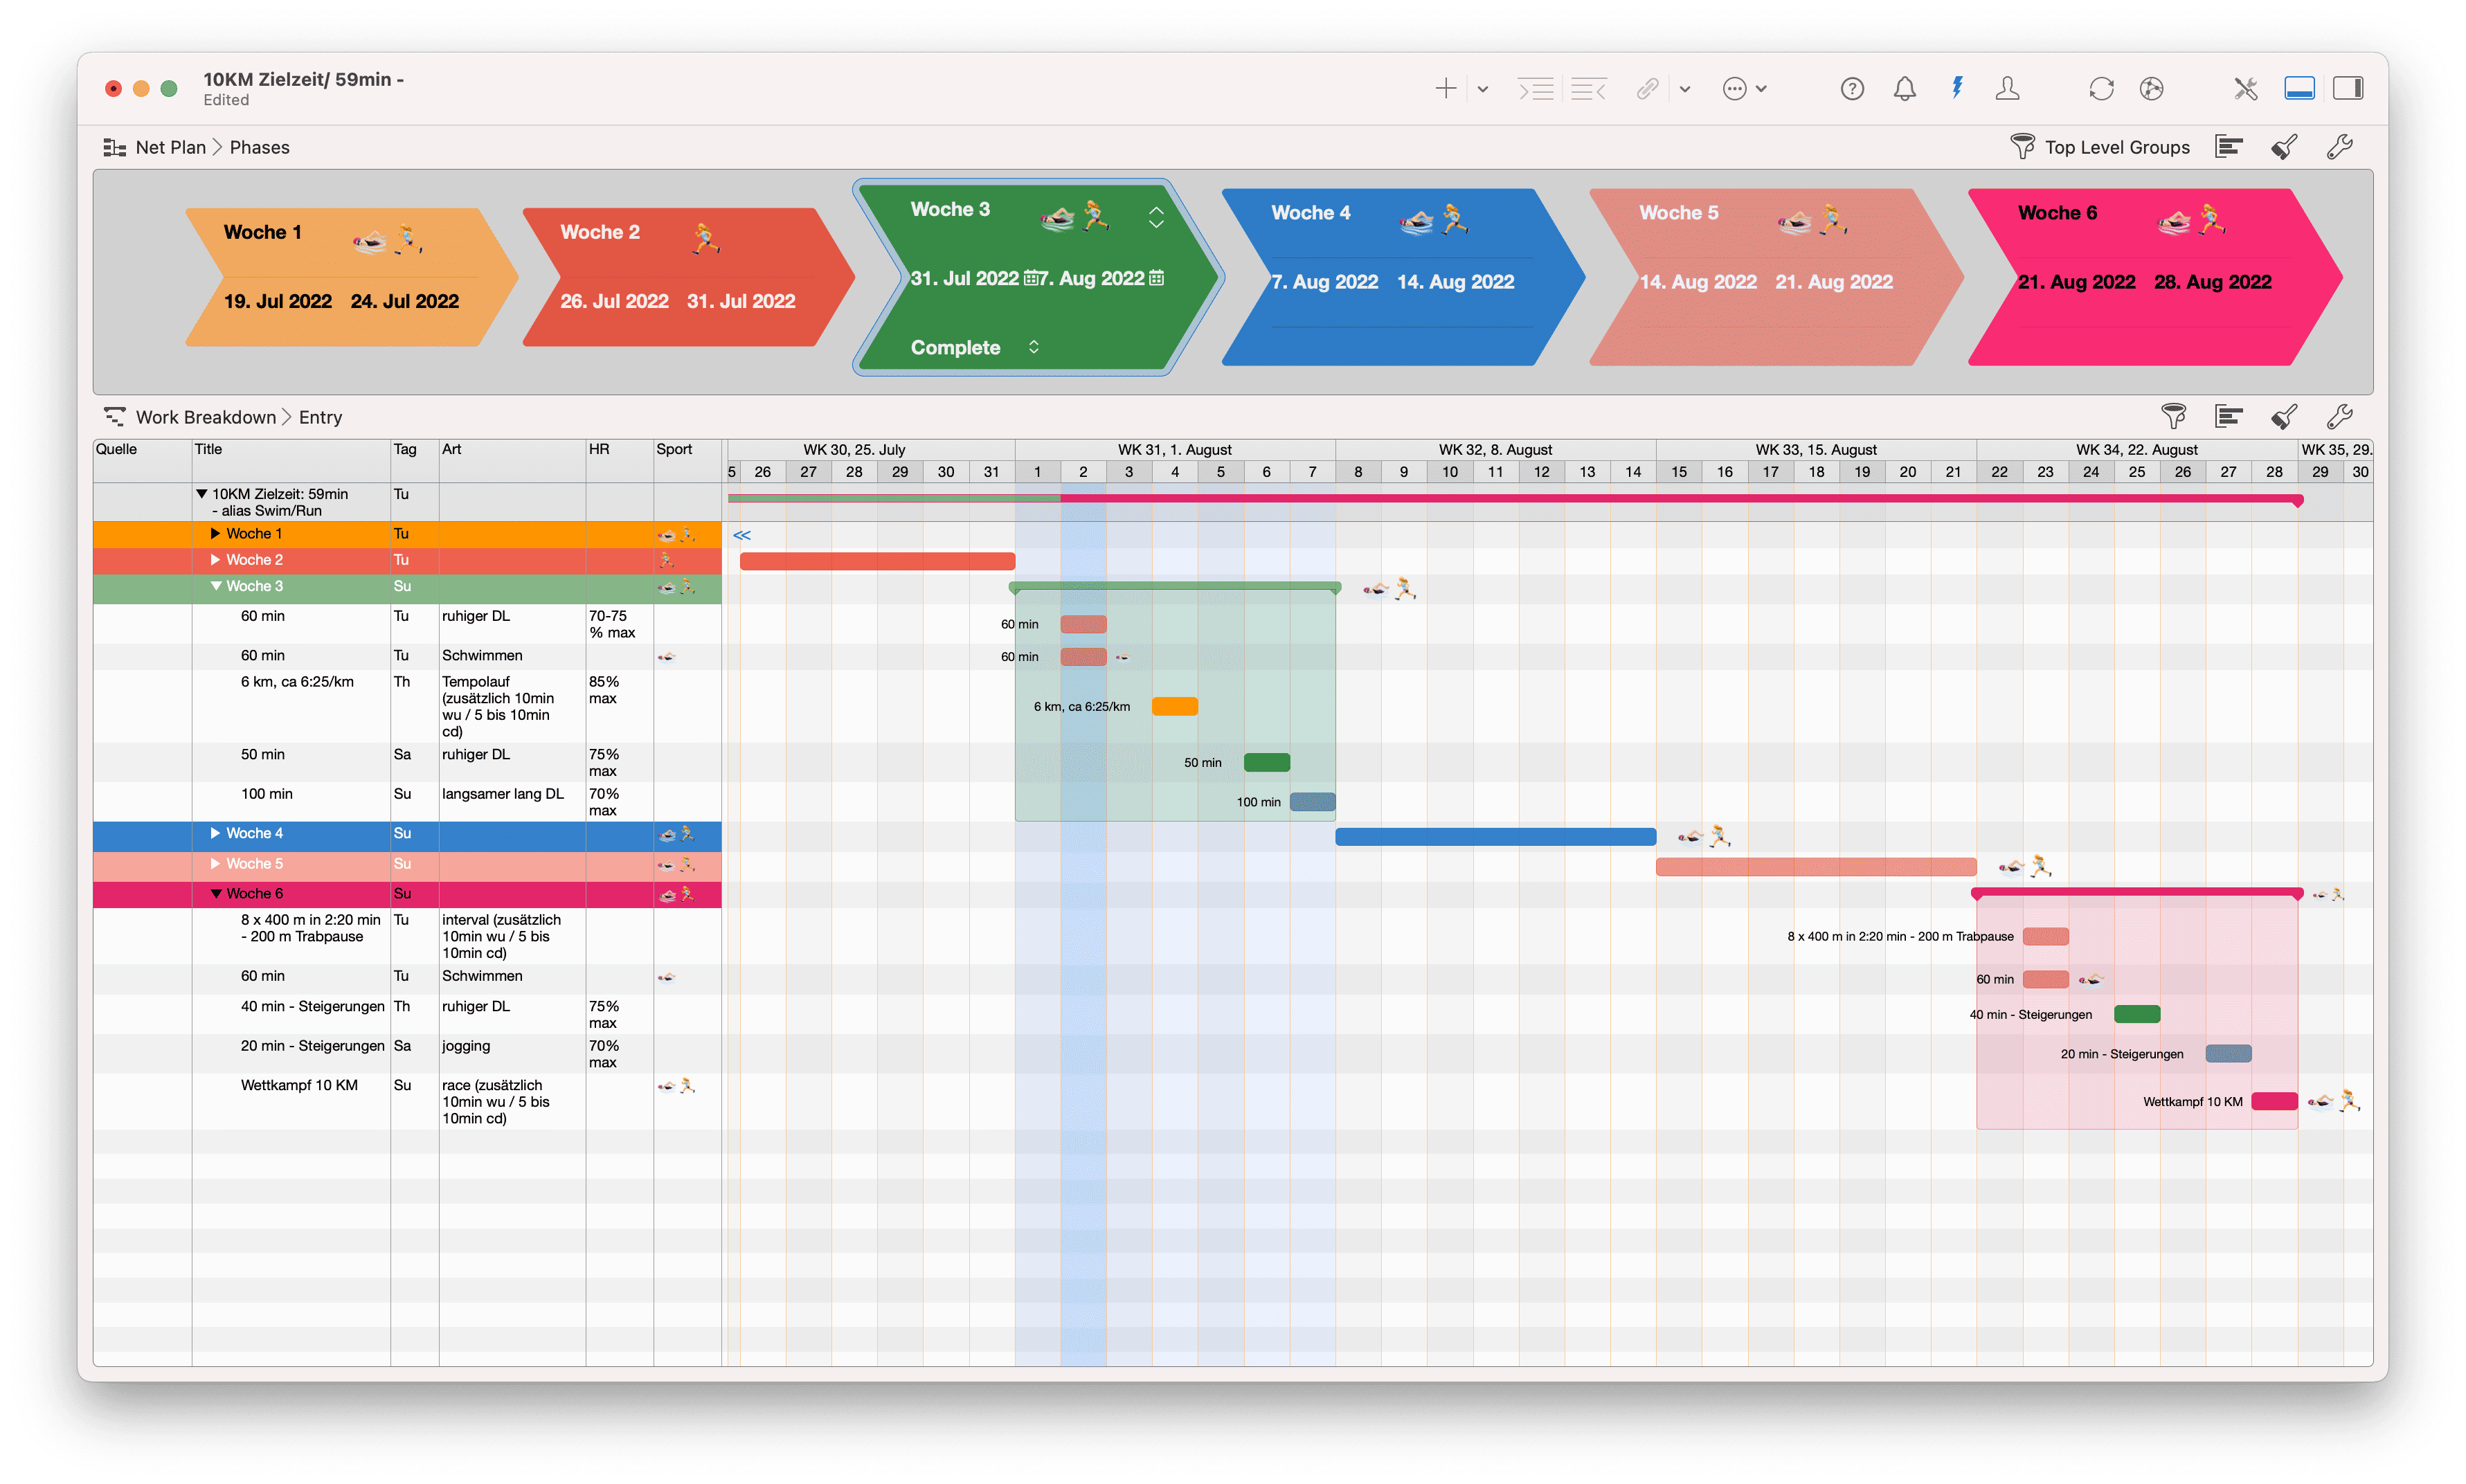
Phases With Gantt
Merlin Project views are highly configurable, so you can customize them to suit your needs or your corporate design theme.
Here is a template with a split view. In one area, you see the phases of your project with start, end and completion percentage as cards of a network diagram. In the other you have the work breakdown with the tasks and the Gantt chart of the plan. The colors in the outline and the design of the bar Gantt elements make it easier to associate the information to the respective phase. Style rules and color-coding give the same coloring to similar tasks, making the understanding of the planning more intuitive.