What Is A Portfolio Or BCG Matrix?
The BCG matrix or portfolio analysis was developed by the Boston Consulting Group. It provides a framework for the analysis of products according to growth and market share. The Matrix has been used since 1968 to help companies gain insight into which products best help them take advantage of market share growth opportunities.
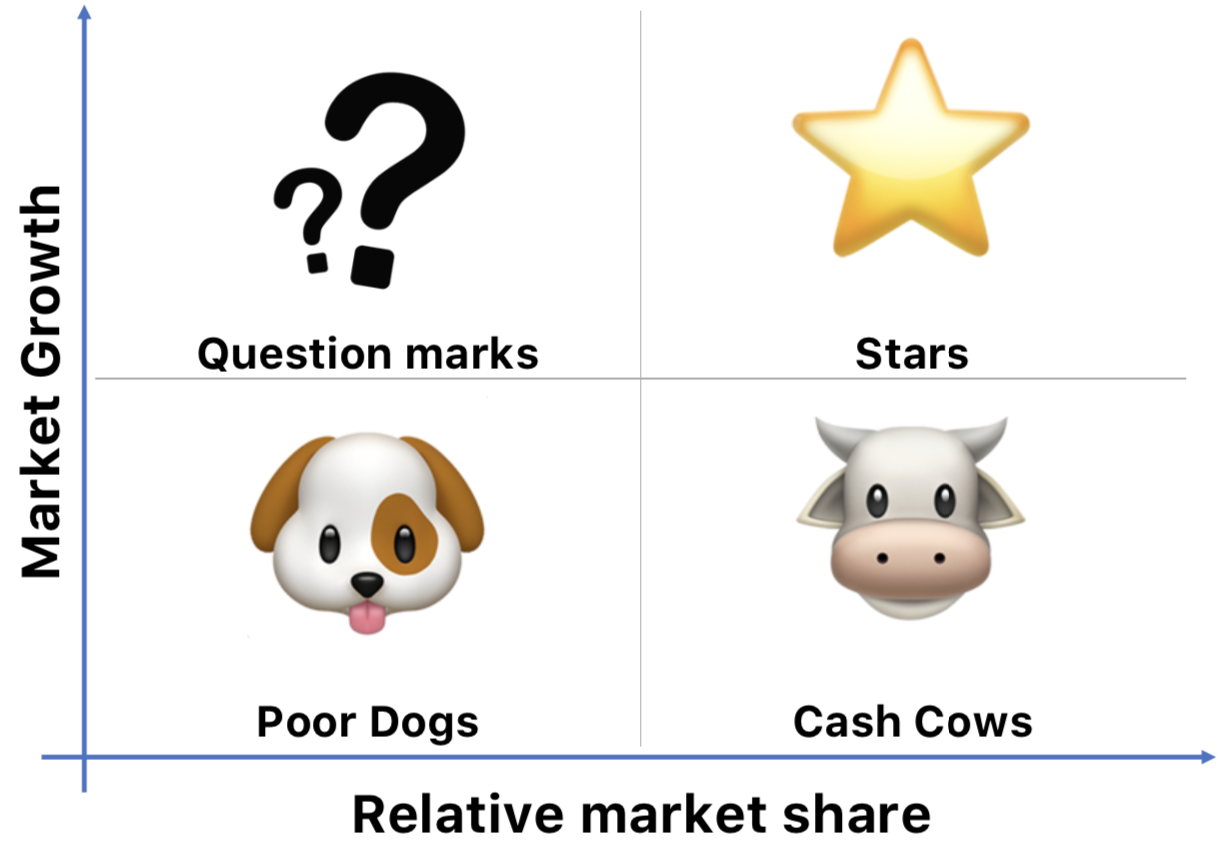
The matrix gathers data on the market share and growth rate of your products or services. The four quadrant chart shows the market share on the horizontal line (bottom left, top right) and the growth rate on the vertical line (bottom bottom, top right). The four quadrants are called question marks (top right), stars (top left), poor dogs (bottom right) and cash cows (bottom left). Place each of your products in the appropriate box depending on where they stand for market share and growth.

Question marks are new products that are introduced to the market after development. The development of this product is in the stars. Although it has a high market growth, it is questionable whether it can prevail against the competing products. It is in the introductory phase of its product life cycle. Thus the investment costs are immensely high and it requires special attention by the management. Companies are recommended to invest in question marks if the product has the potential for growth, or to sell if it does not.
Stars convince through both high market growth and a high relative market share. Ideally, they are in the growth phase of the product life cycle. However, due to their high growth rate, stars consume large amounts of cash. As a rule, this leads to the same amount of money being invested and earned. Stars can develop into cash cows if they can maintain their success until the market growth rate drops. Companies are recommended to invest in stars.
Cash Cows have a low market growth but a high relative market share. Products in this quadrant have successfully completed the start-up phase and are finally in the saturation phase of their lifecycle. The profits generated do not need to be reinvested to consolidate or increase market share or growth. The focus is on absorption. They provide the means to turn question marks into market leaders, cover the company's administrative costs, finance research and development, service the company's debt and pay dividends to shareholders. Companies are advised to invest in cash cows to maintain current levels of productivity.
Poor Dogs have both a low market share and a low growth rate. The Poor Dog is simply the obsolete model in the product portfolio. If it is considered in the product life cycle, this product is in the degeneration phase. They are generally regarded as money traps because companies have tied up money in them, even though they are basically not bringing anything back. These business units are the most important candidates for divestiture.
Understanding cash flow is the key to making the most of the BCG matrix.
- Margins and cash generated are based on market share. High margins and high market shares belong together.
- To grow, you need to invest in your assets. The additional inflow of funds for the investment is a function of the growth rates.
- High market shares must be acquired or purchased. The purchase of market shares requires additional growth or investment.
- No product market can grow indefinitely. You must take your profit from growth when growth slows down; you lose your chance when you hesitate. The payout is in cash, which cannot be reinvested in this product.
Maintaining a healthy supply of question marks prepares you to respond to the next trend, while cash cows need to be milked efficiently because they can fall out of favor faster - and profitability -.

