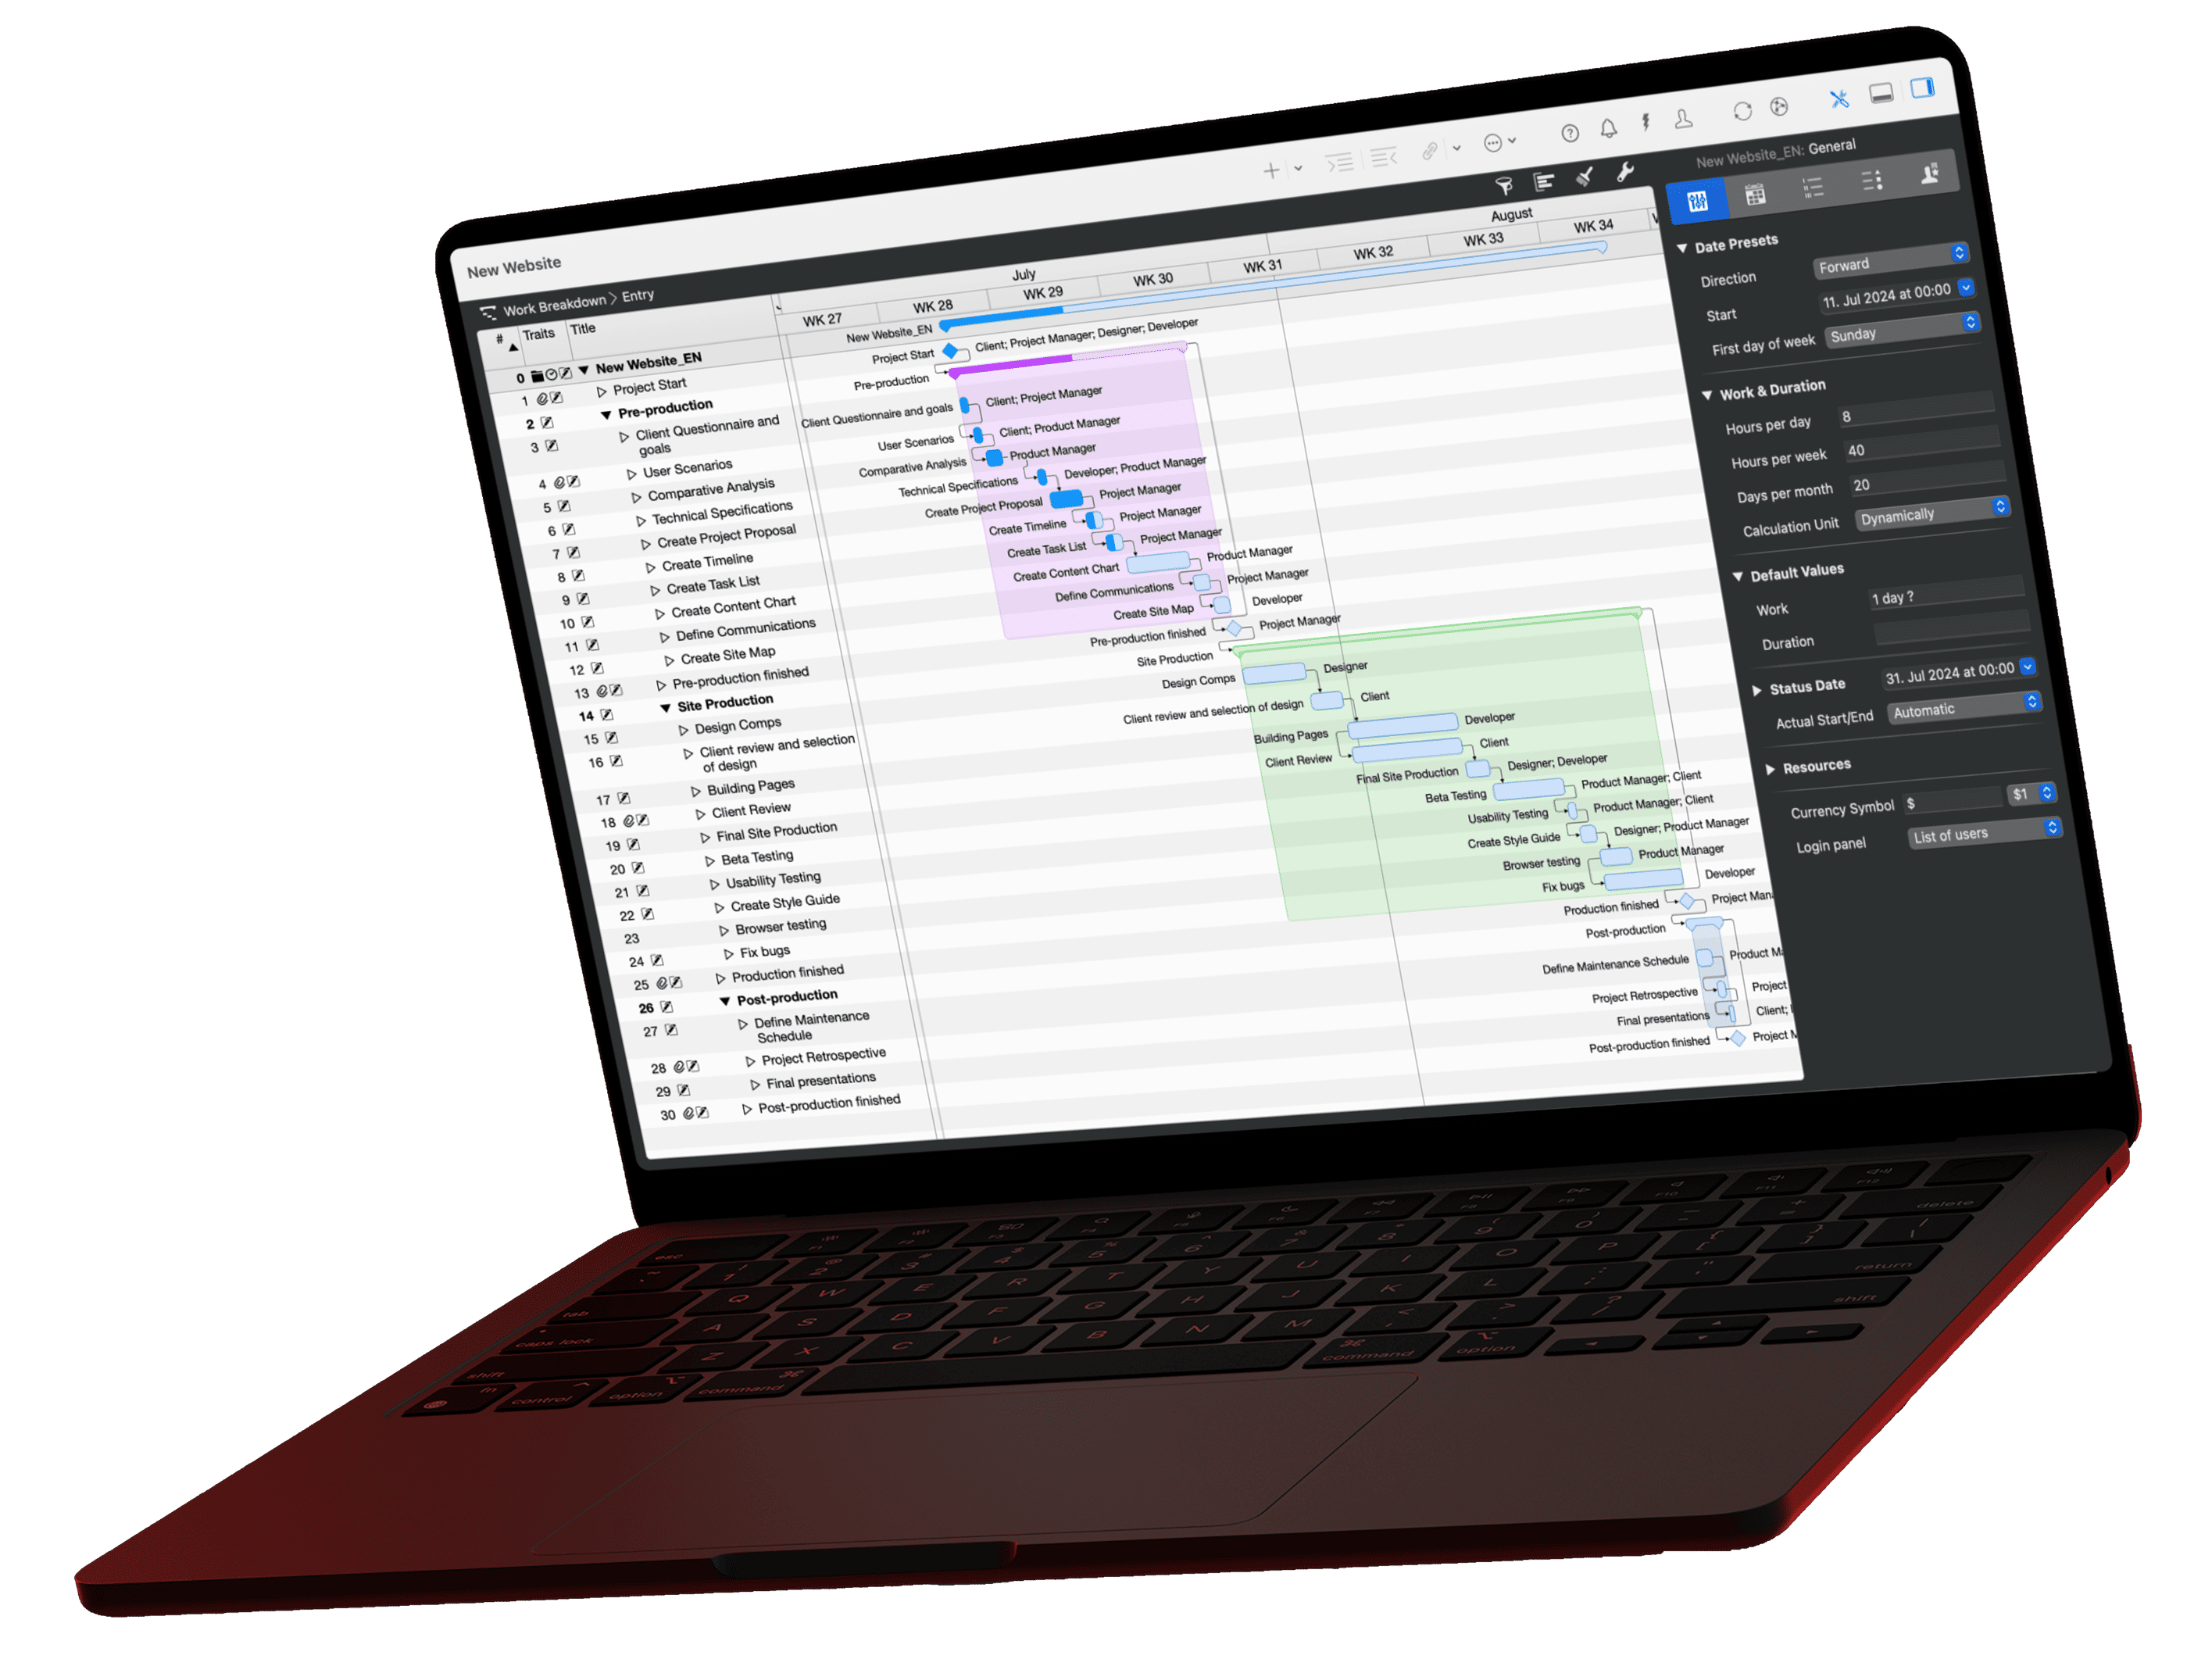
How long did the building permit really take on your last five projects? And when did you last open a completed project plan to read what it says? This guide shows which learnings sit in finished plans and how to turn them into a knowledge base with Merlin Project and the MCP server.
Most estimates come from memory. The project manager thinks of the last similar project, adds a little safety margin and enters a number. Meanwhile, the real values sit in the archive as actual data from completed projects. A project knowledge base makes this data available to every new plan.
What's in It for You
Every proposal starts with the same question: How long will this really take, and what will it cost us? A knowledge base answers it from your own data and gives you four advantages.
- More accurate time estimates. Every task gets the duration that comparable tasks actually needed, broken down by type, supplier, authority or season.
- Buffers with a rationale. Instead of adding a flat ten percent to everything, you place reserve behind the tasks whose duration varies in your data.
- Predictable planning costs. You know the factor by which your team underestimates its own effort and price proposals and fees accordingly.
- Less rework. Known issues already appear in the starting register of the next project, along with the measure that helped last time.
The sample archive for this guide shows how large the effect is: twelve construction projects of an architecture firm from 2021 to 2026, around 1,350 tasks with planned and actual values. We built the archive so that every number in this article can be recalculated; every firm in construction knows the patterns in it. The effect shows most clearly in two daycare centers for the same public client. For Sunshine Daycare, the firm estimated from experience in 2022. When it planned Rainbow Daycare two years later, the actual values of the earlier projects went into the plan.
Daycare centers for the same client
Project duration in working days, plan versus actual, from the sample archive
Sunshine Daycare2022 to 2024, planned from experience
117 WD late
Rainbow Daycare2024 to 2025, planned with archive values
41 WD late
Permit duration, tendering and the shell construction period made the difference: The firm planned them with the lessons from earlier projects. The whole archive confirms the picture. The first seven projects finished on average 23 percent of their planned duration late. For the next three, planned with the suppliers, consultants and authority durations from the analysis, the delay shrank to 8 percent.
The Theory: Why Projects Rarely Learn from Projects
"Those who cannot remember the past are condemned to repeat it."
George Santayana, The Life of Reason, 1905
Projects end, the team moves on, and what went wrong stays in people's heads. In its 2015 study Pulse of the Profession, the Project Management Institute asked how effectively organizations transfer knowledge between projects. Only 14 percent called themselves very effective. Organizations with a high success rate were twice as likely to have a formal process for it: 75 versus 35 percent.
Three findings from research explain the gap.
The planning fallacy. In 1979, Daniel Kahneman and Amos Tversky described how people systematically underestimate the duration of their own undertakings, even when they know similar undertakings took longer. In "Thinking, Fast and Slow" (2011), Kahneman tells the story of his own textbook project: The team expected about two years, comparable teams had needed seven to ten, and many had never finished. In the end it took eight years. Douglas Hofstadter captured the phenomenon as a law in "Gödel, Escher, Bach" in 1979: "It always takes longer than you expect, even when you take into account Hofstadter's Law." Our overview of psychological theories for project managers also covers why people in projects decide the way they do.
Inside view and outside view. Kahneman distinguishes two ways of estimating. The inside view looks at your own project with its plans and assumptions. The outside view asks how comparable projects fared and so includes the disruptions nobody knows in advance. Bent Flyvbjerg built reference class forecasting on this idea: You estimate a new project from the actual results of a class of similar projects. His database covers more than 16,000 projects; according to "How Big Things Get Done" (2023), only 8.5 percent of them met both budget and schedule.
Inside view
No comparison data
Outside view
From the reference class
Tacit and explicit knowledge. In "The Knowledge-Creating Company" (1995), Ikujiro Nonaka and Hirotaka Takeuchi describe how organizations learn: by turning knowledge that people have but rarely put into words into documented knowledge. The sentence "Lane always delivers late" lives in a site manager's head. "Eight to twelve working days late in six out of six projects" is something a new colleague can use too.
A completed plan is therefore a reference class in raw form. The actual values supply the outside view, the risk and issue attachments the documented knowledge. What is missing is the analysis across several projects.
Merlin Project and the MCP Server
Merlin Project stores planned, expected and actual values for each task. On top of that come attachments on tasks, assignments and resources, including risk, issue and information. The series Recording actual progress shows how to capture actual values in a running project; the learn chapter Plan/actual comparison explains the basics.
The MCP server of Merlin Project gives an AI such as Claude read access to this data. You enable it per project with the "AI Tools" button in the toolbar; the MCP documentation describes the setup. Two properties matter for the knowledge base. The server works with all open and enabled documents, and the AI analyzes them project by project. For an archive, you therefore open the completed projects that belong in the analysis. And the server only reads: No plan changes, and you transfer the findings to the next project yourself. The article on digital sovereignty and data privacy explains what happens to your data in the process.
A completed plan holds nine learning sources. The numbered sections after the calculator cover them in this order.
| Learning source | What you learn from it | Data in Merlin Project |
|---|---|---|
| Plan/actual by task type | Estimation factor for recurring tasks | Planned and actual work and duration |
| Suppliers and partners | Schedule reliability per company | Actual end, resource, issue attachments |
| Authorities and deadlines | Duration per authority | Actual duration of permits and deadlines |
| Ranges | Three-point estimate from real data | Actual values from several projects |
| Buffers | Reserve where the variance is | Variance per task type, critical path |
| Season and conditions | Seasonal factors for shell construction and drying | Actual start and actual duration |
| Planning effort and costs | Costing factor for your own services | Work, cost rates, earned value |
| Risks and issues | Calibrated probabilities, starting register | Risk and issue attachments |
| Lessons learned | Transferable rules with a scope | Information attachment, risk field Lessons Learned |
Calculator: What Your Archive Already Yields
Which of these analyses your archive supports today depends on five habits in Merlin Project. The calculator asks about them and shows which analyses are already possible, which are still missing and which step unlocks the most. Each line links to the matching section.
Do you enter the actual end and actual work for completed tasks?
Can you find the same tasks across projects, for example through a "task type" field, tags or fixed names from a shared template?
Are suppliers, subcontractors and authorities assigned to their tasks, as a resource or field?
Do you close risks with "Did Occur", costs and delay?
Do you record lessons learned at project closeout?
Possible today
Not possible yet
Your next step:
Rule of thumb: first patterns appear from about three comparable projects, reliable ranges from five.
1. Plan/Actual Comparison: the Estimation Factor per Task Type
In a running project, the plan/actual comparison serves control. Across several projects, it becomes a learning tool: Actual divided by planned duration gives a factor. If it is above 1 for a task type in every project, the estimation error is systematic. This is Kahneman's outside view, applied to individual tasks. With this factor, you correct new estimates before they go into a proposal. The prerequisite is comparability: If a task is called "Construction Documents: Shell Construction" once and "CD Shell" the next time, no analysis will see the connection.
In Merlin Project, show the columns Planned Work, Actual Work, Planned End and Actual End in the outline. Consistent task names or a custom field such as "Task Type" or "Trade," which you create in the Inspector under User-defined, ensure comparability. Save it in a project template or in the library, and every new project carries it from the start. Through the MCP server, the AI reads planned and actual values for each task.
In Our Sample Archive
The permit from the City Building Authority took twice as long as planned on average, the one from the County Planning Office exactly as planned. With a flat value for "permit," the firm would have estimated both authorities wrong. The next two sections deal with these external factors. The factor for your own work stands out: Construction Documents took 13 to 15 percent longer than planned in every one of the ten completed projects. Add 1.15 and you plan with the measured normal case.
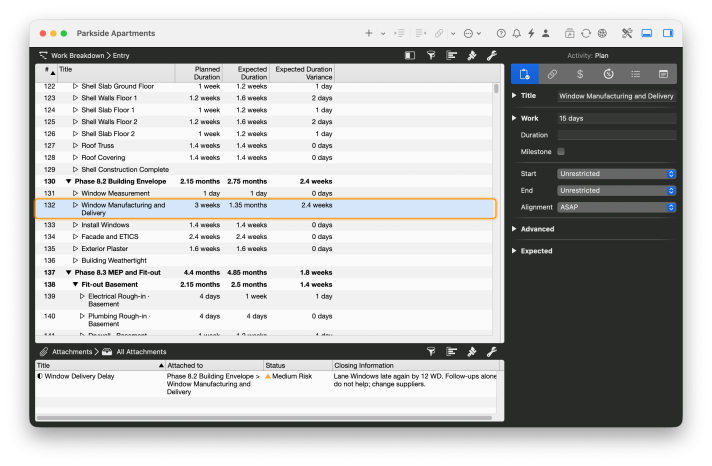
Plan/Actual Comparison in Merlin Project
The Work Breakdown with the columns Planned Duration and Expected Duration: The window delivery was planned at 3 weeks, Lane needed 1.35 months. The lower pane shows the risk of this task including its Lessons Learned.
Try the Prompt Yourself
I have opened ten completed projects in Merlin Project and enabled them
for the AI Tools. Read all completed tasks from each project with their
planned and actual duration. Group tasks with the same name across
projects and calculate the factor actual divided by planned duration for
each task type. Show me a table with the number of projects, the mean
factor, and the smallest and largest value. Sort by the mean factor,
largest deviations first.
2. Suppliers and Partners: Schedule Reliability in Numbers
Deadlines of suppliers and partners are external dependencies: They lie outside your control, and every delay hits all successors. The plan shows the promised lead time, the knowledge base adds the delivered one. This lets you choose suppliers and subcontractors by measured schedule reliability and plan for each one the lead time it actually needs. Watch the denominator: Two delays on two orders weigh more than two on twenty, and only the number of orders turns an impression into a rate. The article on procurement management describes how to manage suppliers from the start.
In Merlin Project, create external companies as resources or enter the company name in a "Supplier" field; this lets you assign every delivery task to a company. Late tasks get an attachment of type Issue with category, type and a short description. The Attachments view lists all issues of a project. The knowledge base needs both: the measured delay from the actual values and the cause from the issue attachment.
In Our Sample Archive
Lane Windows delivered late on every one of its six orders. In the first three projects, this appeared in the plan only as an issue attachment, as an isolated annoyance. Only the comparison reveals the pattern: eight to twelve working days after the promised date, while the building stood open and drywall and screed had to wait. The firm switched to Harper Windows, which delivered at most one day after the promised date. Structural engineering went similarly: Crawford Engineering delivered six working days late twice, Baker stayed on schedule across ten orders.
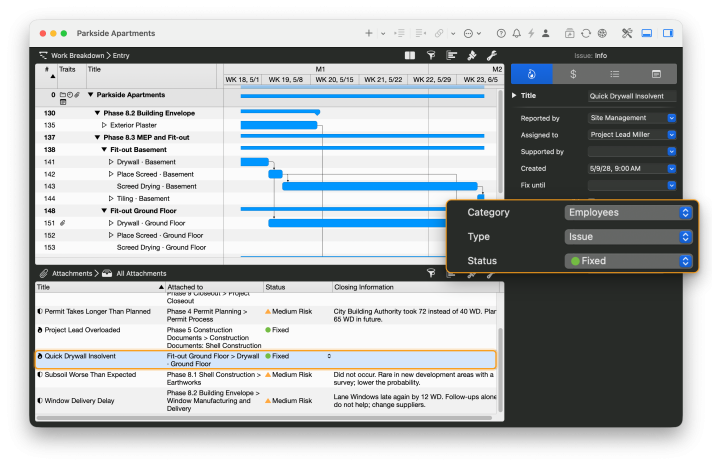
An Issue Attachment in Merlin Project
The drywall contractor's insolvency was in no register. As an issue with category, type and status, it still remains available for analysis, and the AI finds it when searching for recurring failures.
Try the Prompt Yourself
Read the tasks from all enabled projects that involve external companies,
with planned and actual end. For each company, calculate the number of
orders, the mean delay in working days and the largest delay. Add the
issue attachments on these tasks and summarize the causes they name.
Which company is unreliable across several projects, and what data is
that based on?
3. Authorities and Deadlines: Duration per Agency
Agency procedures come early in the project, often on the critical path, and every day of delay pushes everything that follows. Laws and guidance sheets state standard processing times that have little to do with the actual processing time. Plan with the standard time and you estimate from the inside view. Plan permits, reviews and tender deadlines with the measured processing time of the responsible agency instead, and you avoid the most common major delay at the start of a project.
In Merlin Project, model permits and deadlines as separate tasks. Create waiting periods in which only the agency works with a duration and no assignment, and note the responsible agency in an "Authority" field. After completion, enter the actual end, even if no work was done on the task; otherwise the most important actual value of the project is missing. The guide to project management in architecture summarizes the phases and deadlines that shape an architecture project.
In Our Sample Archive
Permit process at the City Building Authority
Working days per project, plan versus actual
2021 to 2023five projects, standard time planned
up to 41 WD late
from 2024two projects, archive value planned
0 to 1 WD
The City Building Authority needed 59 to 72 working days in five projects, against 30 to 40 planned. The County Planning Office met exactly the planned 30 in four projects. With one shared value for both authorities, a firm is off by weeks with the city or wastes reserve with the county. The conclusion: plan the duration per authority. Public tenders follow the same logic. A bid protest cost Sunshine Daycare 20 working days; for Rainbow Daycare, the firm agreed on the evaluation matrix with the procurement office in advance, and no protest came.
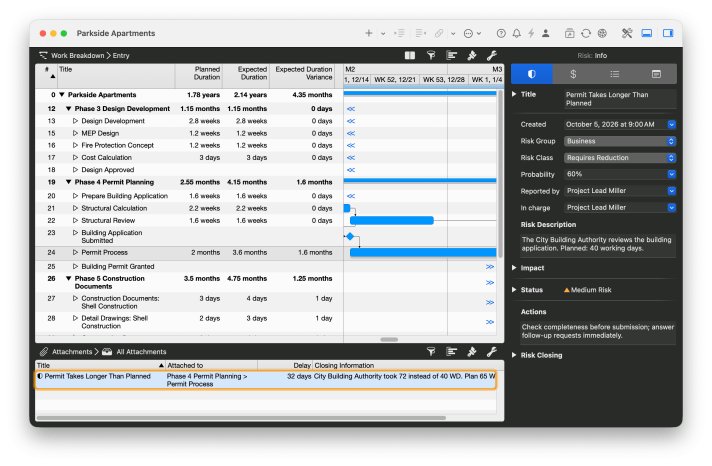
Permit Duration in the Plan
In Parkside Apartments, the firm planned 2 months for the Permit Process; the City Building Authority needed 3.6. The risk below records 32 days of delay, and its Closing Information names the value for the next project: 65 working days.
Try the Prompt Yourself
Search all enabled projects for tasks related to permits, reviews and
tender deadlines. For each task, output the project, the responsible
authority from the project description, and the planned and actual
duration. Group by authority and give the shortest, typical and longest
duration for each. What value should I plan for a new project with the
same authority?
4. Ranges: Three-Point Estimates from Real Data
The three-point estimate describes a task with three values: optimistic (O), most likely (M) and pessimistic (P). The PERT formula (O + 4M + P) / 6 condenses them into an expected value and weights M four times; our guide to PERT charts explains the background. Usually the team guesses the three values. With a knowledge base you measure them: O as the shortest observed value, M as the most frequent, P as the longest. Recurring tasks thus get a reliable range instead of a number that is only right on average. The guide to Monte Carlo simulation shows how a distribution emerges from this.
Merlin Project stores a planned duration and an actual value per task; there is no native three-point estimate. Create two custom fields for O and P and fill them in the template with the values from the knowledge base; the planned duration remains M. The AI reads all three values through the MCP server and runs the simulation with them, as the article Monte Carlo simulation in Merlin Project shows.
In Our Sample Archive
Mean and PERT land at around 66 working days; since 2024, the firm has planned 65. A single value, however, hides how much a task varies. At the City Building Authority, 13 working days separate the shortest and longest procedure, at the County Planning Office not a single one. Only the first case needs reserve. The range of 59 to 72 is also the input for a Monte Carlo simulation; with measured values, it replaces the blanket assumption "planned duration plus or minus 20 percent."
Try the Prompt Yourself
For every task type that appears in at least three enabled projects,
calculate a three-point estimate from the actual durations: O as the
shortest, M as the most frequent and P as the longest value. Also output
the PERT expected value (O + 4M + P) / 6. Flag task types with fewer
than five projects as an uncertain data basis.
5. Buffers: Reserve Where the Variance Is
A buffer protects a deadline against uncertainty. Spread across the board, say ten percent per task, it lands on stable tasks and is missing on the volatile ones. A behavioral effect adds to this. Cyril Northcote Parkinson wrote in The Economist in 1955: "Work expands so as to fill the time available for its completion." Give every task reserve and you will usually see it used up. In "Critical Chain" (1997), Eliyahu Goldratt drew the consequence: take reserve out of the tasks and pool it in front of critical deadlines. The knowledge base tells you how large this buffer must be and where it belongs: behind the high-variance tasks on the critical path. With the same reserve, you then meet deadlines more often.
In Merlin Project, create pooled buffers as separate tasks without assignments in front of the milestone they protect, and give them clear names such as "Buffer Permit." As the project progresses, you then see how much reserve has been consumed. The columns Expected Total Slack and Expected Free Slack show where the network has slack of its own. If the reserve is not enough for the target date, the techniques from the article on fast tracking, crashing and contouring help.
In Our Sample Archive
Flat: ten percent on every task
Targeted: reserve behind the tasks with measured variance
Spread flat, the reserve is missing at the permit, which varies by up to 13 working days in the data; placed deliberately, it sits where the variance is. The size of a buffer follows from the range. If a task in the archive takes between 59 and 72 working days and you plan 66, you need about six days of reserve behind it for high schedule reliability. For a task that deviated by at most one day in ten projects, you can skip the surcharge. Whether the total reserve is sufficient is answered by a Monte Carlo simulation with P80 or P90.
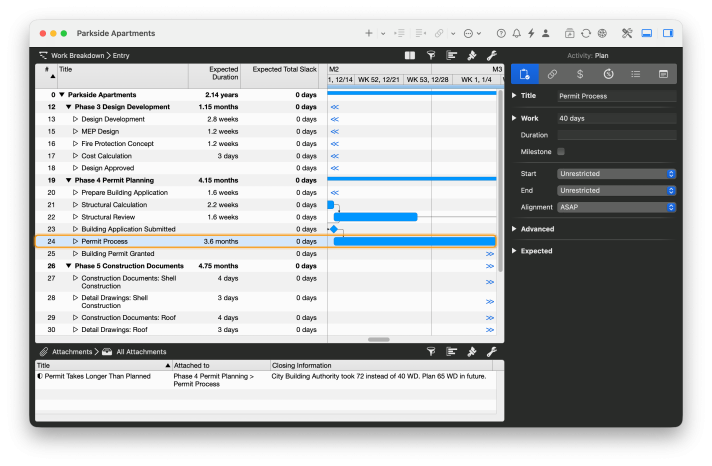
Where the Network Has No Slack
The column Expected Total Slack shows 0 days for the Permit Process. Like every task on the critical path, it has no slack: every day of delay pushes the project end. Which of these tasks needs a pooled buffer only the variance in the archive tells you.
Try the Prompt Yourself
Read the plan of the new project from the current document. Compare
each task on the critical path with the ranges from our knowledge base,
which I am giving you as a file. Suggest behind which tasks a pooled
buffer should sit and how large it must be so that the end date holds
with about 80 percent probability. Name tasks whose planned duration
already contains reserve.
6. Season and Conditions: Seasonal Factors
Some deviations depend on when a task takes place. In construction, frost and rain slow down shell construction, and screed dries more slowly in winter; in software development, vacation periods or a client's quarter-end close have an effect. Such influences hit several tasks at once; Monte Carlo theory calls this correlation. A seasonal factor is the simplest way to bring them into the estimate: You see which tasks take longer at certain times of year and either move them or plan the surcharge in.
In Merlin Project, the AI assigns each task to a season based on its actual start. Model weather-dependent drying and waiting periods as separate tasks without assignments so that their duration remains measurable. Store company holidays and public holidays in the project settings under Calendar; otherwise vacation weeks show up as delay in the statistics.
In Our Sample Archive
Winter cost every shell construction phase time: 15 percent with the reliable contractor, 48 percent with Wagner. Wagner built a quarter slower than planned even in summer. In one project, shell construction stood still for 15 working days because of frost. The rule that follows: do not schedule shell construction between December and February, or price in winter construction with a factor and costs. The Wagner pattern appeared in no risk register. It only becomes visible when someone groups the actual values by company and month.
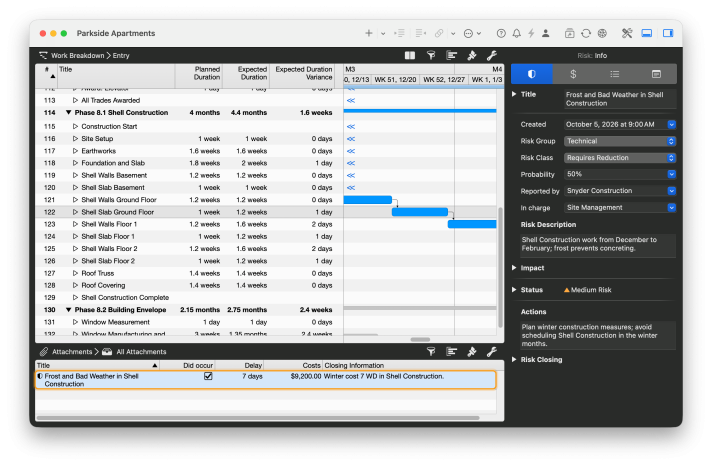
A Winter Risk in Shell Construction
The Shell Slab Ground Floor fell in December. The risk Frost and Bad Weather in Shell Construction occurred, with a Closing Delay of 7 days and costs of $9,200. With dates, actual values and the risk, the task delivers everything a seasonal factor needs.
Try the Prompt Yourself
Group all completed shell construction and drying tasks in the enabled
projects by the month of their actual start and by the contractor that
performed them. For each group, calculate the factor of actual to planned
duration. Are there months or companies in which the same tasks take
significantly longer? Which factors should I plan for shell construction
in January?
7. Planning Effort and Costs: What Your Own Work Costs
Costs deviate in two places: for third-party services through change orders and price increases, and for your own work. Many overlook the second source because it never appears on an invoice. With a fixed fee, the firm bears every underestimated hour itself; the article on fixed price, T&M and cost reimbursement explains which contract type distributes which risk. In a running project, earned value analysis shows the deviation and the cost performance index CPI shows the value delivered per dollar spent. Across completed projects, this becomes a costing factor, and proposals and fees reflect the effort your team really needs.
With an hourly rate per resource, Merlin Project calculates planned and actual costs from planned and actual work; the learn chapter Costs shows how to set up costs. The earned value metrics (PV, EV, AC, CPI, SPI) refer to the status date from the project settings. For a cross-project view of utilization, all projects share a resource pool. In addition, the MCP server provides time-phased values for cost, work and earned value, meaning their progression over weeks or months.
In Our Sample Archive
The firm underestimated its Construction Documents in every project, normally by 15 percent. Across ten projects, this adds up to 118 working days or $95,500 at an hourly rate of $101 that appeared in no fee. The same data holds a second pattern: When three projects were in Construction Documents at the same time, the factor rose to between 1.35 and 1.37, and the project lead reported overload. For costing, this means a 15 percent surcharge on your own planning and at most two projects in this phase at once. On the third-party side, the construction cost inflation of 2021 and 2022 stands out: It hit every project that started in those years, at $22,000 to $151,600 above the cost estimate.
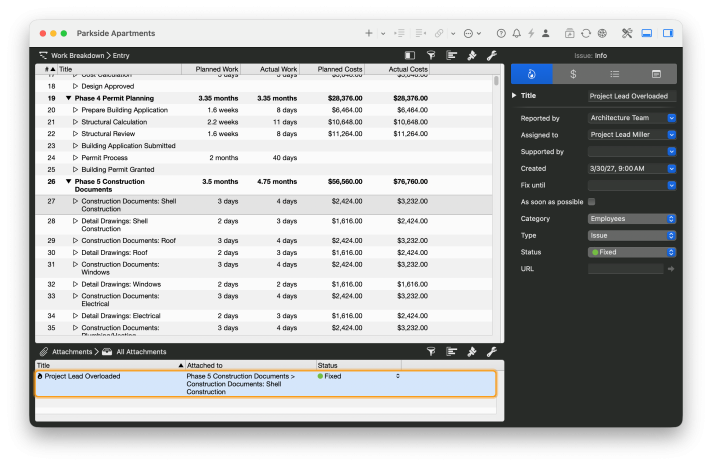
Planning Effort in the Plan/Actual Comparison
The columns show planned and actual work and costs. Construction Documents in Parkside Apartments cost $76,760 instead of $56,560. The issue below names the reason: Project Lead Overloaded.
Try the Prompt Yourself
Read planned and actual work as well as planned and actual costs per
phase from all enabled projects. For each phase, calculate the factor of
actual to planned and the extra effort in dollars. Also use the actual
dates to check how many projects were in Construction Documents at the
same time, and whether the factor rises then.
8. Risks and Issues: Calibrating Probabilities
A risk register contains estimates: How likely is a risk to occur, and what will it cost if it does? At the end of the project, you know what happened. Comparing the two is called calibration. If a well-calibrated team rates risks at 30 percent, about three out of ten of them occur. If the rate deviates strongly, the register directs attention to the wrong places. With calibrated values, the next register starts with the risks that actually occur in your projects. Issues complete the picture with events that nobody had expected as a risk.
In Merlin Project, the attachment type Risk holds four fields for the outcome besides probability and impact: Did Occur, Costs, Delay and Lessons Learned. Costs and delay are for documentation; Merlin does not factor them into the plan or budget. Maintain the fields by project closeout at the latest, or the register remains a list of fears. Record unplanned disruptions as an Issue. The learn chapter Risk management explains the basics, and the guide to risk management with Merlin Project covers control in a running project.
In Our Sample Archive
Calibrating the risk register
Probability in the register versus observed rate in completed projects
Subsoil worse than expected6 projects
overestimated
Window delivery delay, Lane3 projects
underestimated
Window delivery delay, Harper3 projects
never occurred
The register matures over time. The first four projects contain seven risks between them; they recorded the window delay only as an issue. From the fifth project on, the firm adopted the lessons of the earlier projects as risks with measures. Calibration brought two corrections. The subsoil risk was in the register at 30 percent in six new builds and occurred once, on a lot with existing structures; for new subdivisions, it dropped to 15 percent. Switching suppliers resolved the delivery delay with Lane, which had occurred on all three orders. A third pattern, the slow shell contractor in winter, appeared in no register. A knowledge base therefore needs both sources: documented risks and plain deviations in the actual values.
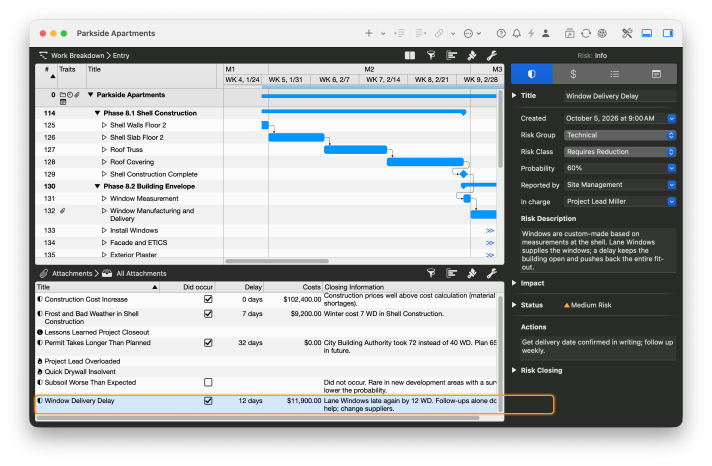
A Closed Risk
Window delivery delay, occurred with 12 days of delay and $11,900 in costs. Only the closing fields, shown here as columns in the register, turn a fear into a data point for calibration.
Try the Prompt Yourself
Read the risk attachments from all enabled projects with title,
probability, Did Occur, Costs, Delay and Lessons Learned, as well as all
issue attachments. Group similar risks across projects. For each risk,
compare the estimated probability with the observed rate. Also list
issues that occurred more than once but never appeared as a risk in any
register. From this, create a starting register for a new project with
a suggested probability, typical impact and proven measure.
9. Lessons Learned: Rules with a Scope
Lessons learned provide the reasoning behind the numbers: why something took longer and what helps next time. Their value depends on two things. The first is the attitude in the closing meeting. In 2001, Norman Kerth formulated the "Prime Directive" of the retrospective for this: "Regardless of what we discover, we understand and truly believe that everyone did the best job they could, given what they knew at the time, their skills and abilities, the resources available, and the situation at hand." If you look for someone to blame, you do not get honest answers. The second is the scope: A lesson from renovating an old building does not automatically apply to a new build, and without a statement of what it applies to, it remains an anecdote. With a scope, colleagues who were not involved can also find the lesson. The project closing process describes the formal framework.
In Merlin Project, attach an attachment of type Information with the lessons learned to the "Project Closeout" milestone: what went wrong, what worked and which type of project the lesson applies to. Lessons about individual risks belong in their Lessons Learned field, where they stay linked to frequency, costs and delay. You can create a separate type "Lessons Learned" for information attachments in the project settings under Value Lists.
In Our Sample Archive
Two renovations of old buildings show how strongly a lesson with a scope works. In the Victorian rowhouse, the crew found asbestos during demolition: 22 working days of work stoppage, a $41,800 change order. The lesson read "Hazardous materials survey before the tender, applies to every renovation of an existing building." For the later timber-frame house, the firm had the survey done in advance; the abatement was therefore already in the bill of quantities.
Custom requests from private clients went similarly. The Vineyard Hill Duplex lost 15 working days and $41,200 to changes during fit-out, so a later single-family home got a selections deadline before fit-out began.
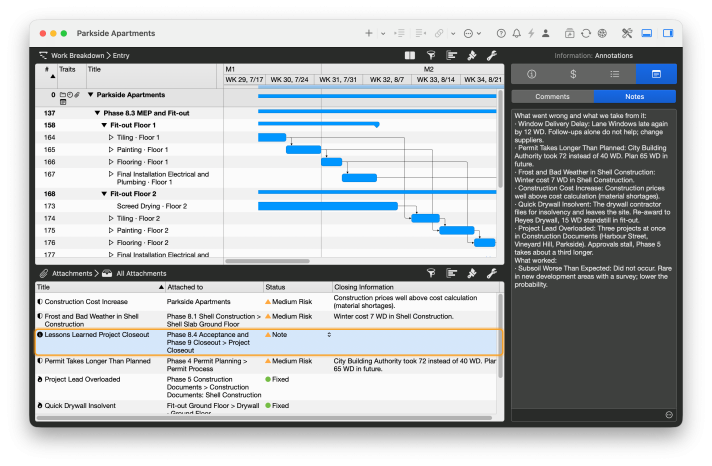
Lessons Learned at Project Closeout
An information attachment on the Project Closeout milestone records what went wrong and what worked. Through the MCP server, the AI reads it together with the actual values.
Try the Prompt Yourself
Read the information attachments on the "Project Closeout" milestone and
the Lessons Learned field of all risks in the enabled projects. Turn
them into transferable rules. For each rule, state which project type,
phase or trade it applies to, how many projects support it, and which
projects it is based on. Leave out one-off cases that occurred only once
and name no cause.
From Archive to Knowledge Base
The nine analyses form the knowledge base. For the team to use it, it needs a fixed form that grows after every project. A document project with five chapters, which the AI fills from the Merlin projects, has proven itself:
Project-Knowledge-Base/
├── index.adoc                 Purpose, data status, usage
├── 1-projects/                one profile per completed project
├── 2-metrics/                 estimation factors, ranges, costs
├── 3-risks-and-learnings/     risk catalog, lessons learned, starting register
├── 4-templates/               prompts and checklists
└── 5-methodology/             data basis, maintenance rules, glossary
The profile for each project records project type, period, schedule and costs as a plan/actual comparison, plus the five largest deviations, risks that occurred and lessons learned. The AI calculates chapters 2 and 3 from all profiles, and every value points to the projects it comes from. As AsciiDoc files, the chapters can be exported by adoc Studio as a website whose navigation comes from folders and files; the project template for documentation offers a ready-made structure to adapt. Because the knowledge base contains client names, costs and schedules, it belongs on a protected server.
After every completed project, you add a profile, the AI recalculates chapters 2 and 3, and you export the website again.
What You Should Maintain Starting Today
Five habits decide whether your archive shows patterns or gaps a year from now. The calculator shows where you stand today.
- Record actual values promptly: actual start, actual end and actual work for every completed task, including waiting periods and permits.
- Classify tasks, most easily through a task type field or tags in a shared project template. Fixed task names from the template do the same, as long as nobody changes them.
- Assign external partners, as a resource or field, so that their schedule reliability can be measured.
- Close risks with Did Occur, Costs, Delay and Lessons Learned, by project closeout at the latest.
- Lessons learned with a scope as an information attachment on the "Project Closeout" milestone.
Limits of the Analysis
A knowledge base provides empirical values that become more accurate with every project. Four limits come with it.
- Small samples. Two late deliveries on two orders are an indication. Have the AI state the number of projects for every value, and treat values from fewer than five projects as provisional.
- Correlation without cause. The numbers alone do not tell you whether the shell contractor was slower in winter because of the weather, its workload or both. The reasoning is in the lessons learned.
- Changed conditions. A new team, a new procedure at the building department or a different market devalue old values. Date every value and weight recent projects more heavily.
- Read-only access. The MCP server of Merlin Project currently only reads. You transfer factors, buffers and the starting register to the new plan yourself. Cloud clients such as Claude send the queried plan data to the provider; a local model keeps it on your Mac.
The next step builds on this knowledge base. With the starting register from chapter 3 and the ranges from chapter 2, you manage the risks of the running project; the guide to risk management with Merlin Project and AI shows how this works in Merlin Project.
If you have any questions about this blog article or would like to discuss it, we look forward to your contribution in our forum.
Frequently asked questions
What is a project knowledge base?
A project knowledge base collects the experience from completed projects in a form you can analyze: estimation factors from the plan/actual comparison, ranges for recurring tasks, risks that occurred and lessons learned. New projects use these values for estimates, buffers and the starting register.
How many projects do I need for reliable values?
From three projects with the same task type, first patterns emerge; from five, ranges become reliable. Mark values from fewer projects as provisional and update them with every new project.
Which data from Merlin Project goes into the knowledge base?
Planned and actual dates, work and costs per task, risk attachments with the fields Did Occur, Costs, Delay and Lessons Learned, issue attachments, and information attachments with the lessons learned at project closeout. Custom fields for task type, supplier or authority make tasks comparable across projects.
Can the AI analyze several projects at once through the MCP server?
The MCP server works with all documents open in Merlin Project and enabled for the AI Tools. The AI switches between them and analyzes project by project. For an archive analysis, open the completed projects that belong in the analysis.
What is the difference between the mean and the PERT estimate?
The mean weights all observed durations equally. The PERT estimate (O + 4M + P) / 6 weights the most likely value four times and counts the shortest and longest values once each. With individual outliers, PERT stays closer to the typical case.