The deadline is fixed, your plan ends three weeks later. Three techniques bring your plan back on track: fast tracking compresses the sequence, contouring the workload, crashing buys time with budget. This article explains all three, shows when each applies and how to put them into practice in Merlin Project.
Every schedule comes under pressure eventually. A supplier is late, an approval takes longer, a trade show moves forward. The first reaction is usually to trim durations until the result fits. That is not planning, it is wishful thinking on paper.
In project management, there are three clean techniques for this situation, each starting at a different point. Fast tracking changes the sequence: activities run in parallel instead of one after another. Crashing shortens individual activities by adding resources. Contouring changes how the work is distributed within an activity, so the effort sits where it actually occurs. Fast tracking pays with risk, crashing with money, contouring with nothing but a closer look at your own plan.
What is fast tracking?
Fast tracking shortens the project duration by running activities in parallel that were planned in sequence. The successor starts before its predecessor is finished. The amount of work stays identical, only the plan is stacked more densely.
An example from product development: concept four weeks, implementation six weeks, testing four weeks. Planned sequentially, that is 14 weeks. If implementation starts as soon as the core requirements are settled, and testing begins with the first finished modules, both handovers overlap by two weeks each. 14 weeks become 10.
Fast tracking: the same work, stacked more densely
Product release with three activities, originally 14 weeks
Planned sequentially 14 weeks
With fast tracking 10 weeks
Project weeks
When fast tracking works and when it does not
Whether an overlap is possible depends on the type of dependency between the activities.
Mandatory dependencies follow from the matter itself. Concrete has to cure before the next layer goes on. A contract has to be signed before you order. That sequence cannot be parallelised; every attempt produces scrap or liability questions.
Discretionary dependencies arise from habit, caution or internal convention: "We only start once the concept has been approved." Technically, the start would often be possible much earlier. This is exactly where fast tracking applies.
The practical test: which part of the predecessor has to be stable for the successor to start sensibly? Pull that part forward and let the rest overlap. If you cannot answer the question, the dependency is probably mandatory and fast tracking is the wrong tool.
Just as important: only overlap on the critical path. An activity with float can be pulled forward at will without changing the project end. And after every overlap, the critical path may move to a different chain, which determines your next step.
What is crashing?
The second lever starts at the same place but uses different means: crashing shortens the duration of individual activities by adding resources, such as more staff, overtime, weekend work or a bought-in service. The sequence stays untouched, the costs rise. Where fast tracking pays with risk, crashing pays with budget.
Which activity to accelerate first is answered by the cost slope. It relates the additional cost to the time saved:
(crash cost - normal cost) / (normal duration - crash duration)
If shortening one activity by two weeks costs 4,000 Dollar and another one costs 1,500 Dollar for one week, the second is the cheaper entry point at 1,500 Dollar per week, even though it gains less time in absolute terms. Accelerate in that order, always on the critical path only, and recalculate after each step.
Crashing does have a limit, and it is not a financial one: additional people need onboarding and create coordination effort. On a project that is already late, more staff can push it back further, an effect known as Brooks's law. Divisible work with little coordination crashes well, conceptual work barely at all.
Amdahl's law: the ceiling on any parallelisation
How much additional resources can achieve at all is capped by the share of the work that has to stay sequential. Gene Amdahl formulated this in 1967 for processors; the same structure applies to people:
S(n) = 1 / (s + p / n)
Here s is the sequential share, p the parallelisable share with s + p = 1, n the number of resources and S(n) the speedup over a single resource. The larger n gets, the smaller p/n becomes: the factor converges towards 1/s and never goes beyond it.
An activity of 12 person-days, 3 of them sequential for concept, sign-off and acceptance, has s = 0.25. With two people, S = 1 / (0.25 + 0.75 / 2) = 1.6, so 12 days become 7.5 rather than the hoped-for 6. With five people it is 4.8 days, and no headcount at all gets you below 3. So before every crashing decision, check which part of the activity can genuinely be split.
What is contouring?
Contouring describes how the work of a resource is distributed across the duration of an activity. By default, planning tools assume an even distribution: 40 hours over 10 days equals 4 hours per day. Yet virtually no activity runs that way.
A concept phase starts intensively and tapers off. An acceptance phase only picks up towards the end, when defect lists are worked through. A trade show build has two peaks, one for setup and one for teardown. The contour maps when the work really happens.
Four work distributions, the same 40 hours
One activity across 10 working days, maximum 8 hours per day
Flat
Routine work without ramp-up or ramp-down
Peak: 4 hrs per day
Front-loaded
Analysis, concept, setup
Peak: 8 hrs on day 1
Back-loaded
Testing, acceptance, defect fixing
Peak: 8 hrs on day 10
Bell
Construction stage, campaign with ramp-up
Peak: 7 hrs in the middle
Why an even distribution is expensive
The calculation "40 hours over 10 days" looks harmless, but it hides two errors at once.
First, overloads become invisible. Two activities of the same person at 4 hours per day each report 100 percent utilisation together, an inconspicuous plan. If the real peaks of both activities fall into the same week, 16 hours per day are needed there, while the person is barely committed in other weeks. The average looks clean, the conflict only surfaces during execution.
Second, free capacity disappears. A resource that is committed for only one hour per day in week two counts as half utilised under an even distribution. That reserve is unavailable for a parallel project even though it really exists. Contouring brings it back into the plan.
This is precisely why contouring is the prerequisite for sensible fast tracking. Anyone who overlaps activities without knowing the actual effort peaks parallelises two activities that both need the same person at 100 percent at the same time. The plan looks shorter, the team still works sequentially.
The techniques compared
Three techniques, one goal, three entirely different prices. The overview sorts out which one applies when and what it costs.
| Fast tracking | Crashing | Contouring | |
|---|---|---|---|
| Also known as | overlapping, parallelisation | schedule compression by added resources | work contour, work distribution |
| Starting point | sequence of activities | duration of individual activities | distribution of the work |
| Effect | shorter project duration | shorter project duration | realistic utilisation |
| Cost | none directly | rising staff and material cost | none |
| Risk | rework, loss of quality | friction, onboarding | misjudged peaks |
| Prerequisite | discretionary dependency | divisible, accelerable work | knowledge of the work profile |
| Check first when | the deadline is fixed and time is short | budget is available | planning capacity at all |
The order in practice: contouring first, because it costs nothing and provides the basis for everything else. Then fast tracking, because it needs no budget. Crashing last, because it is the only one that directly costs money.
How to do it in Merlin Project
The order decides the outcome: anyone who parallelises first and checks utilisation afterwards merely moves the problem from the time axis to the resources. The following sequence keeps the order and shows for each step how to apply it in Merlin Project. What helps here is that logic and utilisation live in the same file: you drag an overlap in the Gantt chart and see one view later what it does to the team.
1. Determine the critical path
Shortening only works on the critical path. Every hour you put into an activity with float drains effort without moving the deadline. And because the critical path shifts with every compression, this step is not one-off preparation but the check after every further step.
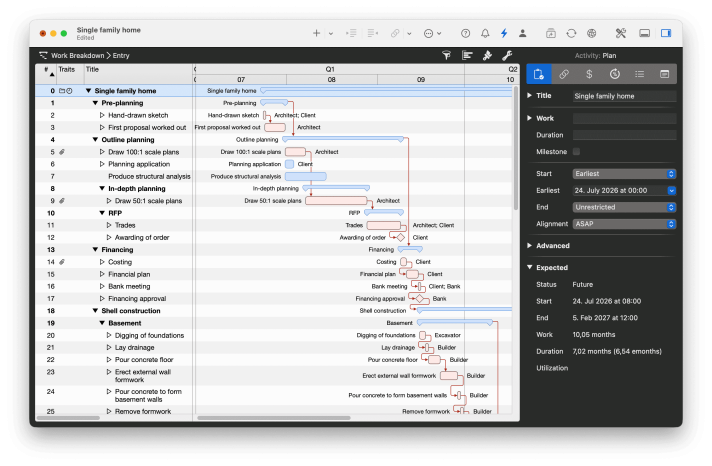
In Merlin Project you toggle the critical path with the lightning symbol in the toolbar. The Gantt chart then shows immediately which chain determines the deadline and which activities have room. For the view on an individual dependency, the columns Expected critical and Planned critical answer the same question in detail.
One click on the lightning symbol
The lightning symbol in the toolbar switches the critical path display on and off. When it is active, Merlin Project colours every activity and dependency red that determines the deadline: in the example, the chain runs from the hand-drawn sketch through outline and in-depth planning into the shell construction. Whatever stays blue has float; compressing there costs effort without moving the deadline. How bars, dependencies and float work together is shown in the guide to the Gantt chart.
2. Map the work distribution realistically
Before you overlap anything, you need to know when the effort in the activities involved really occurs. That is what contouring delivers. If you plan with average values, you will not be able to tell later whether an overlap holds or whether two peaks collide.
Merlin Project has no dedicated field for this. An activity always distributes its work evenly across its duration, and utilisation does not change that either, because it applies to the entire assignment and not to individual days. The lever is the pair of values Planned work and Planned duration instead: work is the effort, duration is the window in which it is done. 40 hours of work with a duration of 10 days results in 4 hours a day.
An uneven contour is built from this by splitting the activity into sections and giving each section its own values. Here is how the same "Concept" activity with 40 hours across 10 working days looks in the four profiles:
| Contour | Sub-activities with work and duration | Result per day |
|---|---|---|
| Flat | one activity: 40 hrs work, 10 days duration | 4 hrs every day |
| Front-loaded | 24 hrs / 3 days, then 10 hrs / 3 days, then 6 hrs / 4 days | 8, then 3.3, then 1.5 hrs |
| Back-loaded | 6 hrs / 4 days, then 10 hrs / 3 days, then 24 hrs / 3 days | 1.5, then 3.3, then 8 hrs |
| Bell | 6 hrs / 3 days, then 28 hrs / 4 days, then 6 hrs / 3 days | 2, then 7, then 2 hrs |
Link the sections with End-to-Start and collect them in a group, and the plan stays readable while the group sums work and duration back up to the original activity. The effort is not worth it everywhere: it pays off for long activities on the critical path and for scarce resources, which is exactly where you are about to overlap. Recurring absences, by contrast, do not belong in the contour but in the resource calendar.
3. Place overlaps where the peaks are offset
Only now do you overlap, and deliberately so: a front-loaded predecessor and a back-loaded successor tolerate a lot of overlap, because the quiet end of one meets the quiet start of the other. The other way round, the peaks collide right in the overlap zone and the time gain turns into overload.
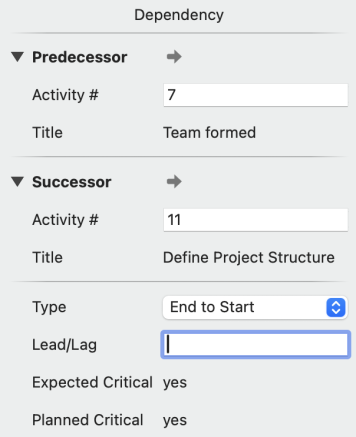
Fast tracking is not a separate function in Merlin Project, it is a property of the dependency. Click the connecting line between two activities and the Dependency inspector appears with the Lead/Lag field, which also accepts negative values. The sign decides the direction: on a End-to-Start dependency, a lead/lag of 2 days pushes the successor back, a lead/lag of -2 days pulls it forward. It then starts two days before its predecessor finishes, and those two days are the overlap. If two activities should generally start together, switch the type from End-to-Start to Start-to-Start instead.
It matters that the overlap is kept as lead/lag and not as a fixed start date. A pinned date cuts the dependency: if the predecessor moves, Merlin Project no longer recalculates the successor.
Back to the example from the beginning: implementation and testing overlap by two weeks. If testing only ramps up during that time anyway, because the test environment is being built, the overlap costs practically nothing. If its opening peak meets the closing peak of implementation and both depend on the same person, the four weeks gained are pure arithmetic. Which of the two cases applies is what you see in the next step.
Fast tracking happens in the Lead/Lag field
Fast tracking is applied through the lead/lag of an existing dependency. Enter a negative value there, for example -2 days, and on a End-to-Start dependency the successor moves forward by two days and starts before its predecessor is finished. A positive value does the opposite and pushes it back as waiting time. How to create and adjust dependencies is shown in the lesson Adding context and logic.
4. Recalculate and level the utilisation
If the plan shows overload after the overlap, the time gained is not real, it has merely moved from the time axis into the resources. The team still works sequentially, it just looks different in the plan.
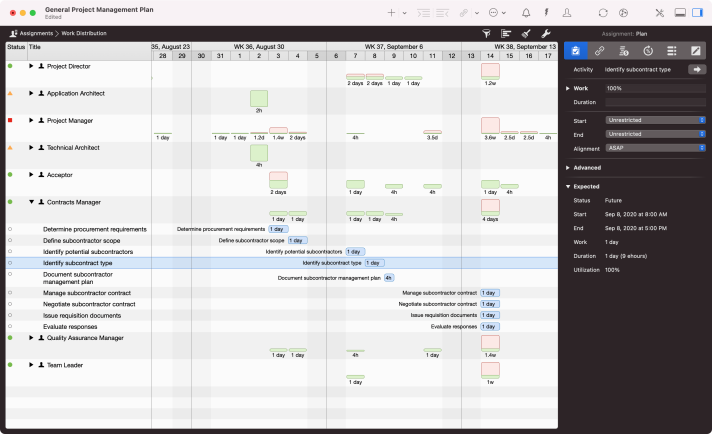
The reality check for this is the work distribution: red days mean overload. The threshold at which Merlin Project marks red is set under Utilization in the settings, via the thresholds for over- and under-utilisation. If overload remains, resource levelling helps, either for the whole project or for a selection only. Activate the option Within slack only, otherwise levelling resolves the overload by pushing the deadline you just pulled forward back again.
Assignments and work distribution
The Assignments view with the Work distribution layout shows for each resource how much work falls on which day. Green means within limits, red means overload; in the example you can see at a glance which roles are booked beyond their capacity on which days. After every overlap this is the quickest test of whether the time gained is real or only looks good in the Gantt chart. How to create and assign resources is shown in the lesson Setting up resources.
5. If it still does not fit: add resources
If time is still short, crashing remains. In Merlin Project this is the simplest of the three steps: drag a second resource from the resource source onto the activity, both share the work, and the duration drops accordingly. 40 hours of work that one person delivers in five days become two and a half days with two people.
There is one prerequisite: the activity has to be planned by work, so the Duration field stays empty. If a fixed duration is entered there, the bar stays the same length and only the utilisation per person drops, which is the opposite of what you want. Whether several assignments share the work or each carries the full effort is controlled in the settings via the option share the work.
Do not rely on the arithmetic alone: halving the duration assumes the work can genuinely be split. For coordination and onboarding, add a margin rather than taking the halved bar at face value.
6. Name the residual risk and secure the result
Every overlap is a bet on the stability of the predecessor. Record what has to be redone if something changes and what that costs, instead of keeping it in your head.
Set a baseline on the original plan before you enter the first overlap. After that, the planned/actual comparison shows at any time what the compression achieved and where it backfires. Attach the looming rework as a risk to the overlapped activity, with probability and assessment.
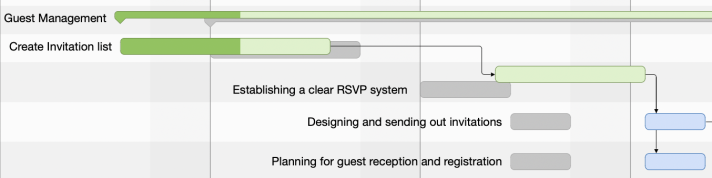
The baseline as a grey shadow
Once a baseline is set, Merlin Project places the planned values as grey bars behind the current ones. You can see at a glance which activity was pulled forward and which slipped despite the compression. The lesson on the planned/actual comparison shows how to set and evaluate the baseline. The risk of rework is stored as an attachment of type risk directly on the overlapped activity, together with probability and assessment. Since version 9 the comparison also works retroactively: the dynamic baseline reconstructs the planned state of any earlier point in time via a reference date in the project settings, even if nobody set a baseline back then. More on this in the article on Merlin Project 9.
Best practices
- Only compress on the critical path, and recalculate after every step. Shorten one chain and another often becomes critical.
- Only overlap discretionary dependencies. Overriding a mandatory dependency does not give you a faster project, it gives you scrap.
- Define handover points instead of completion. "The successor starts once the interface is stable" is a workable condition, "when it is done" is not.
- Check the resources before you believe the time gain. Two parallel bars in the Gantt chart are only genuinely parallel if two people can work on them.
- Map part-time work in the calendar, not in the contour. Someone who is out on Tuesdays belongs in the resource calendar, not in an improvised work distribution.
- Plan for rework instead of arguing it away. If you overlap by two weeks, carry one week of correction effort as a risk in the plan.
- Discuss the new way of working with the team. Fast tracking makes handovers provisional and changes more likely. If you do not announce that, you will meet frustration as soon as results are reopened. The realistic contour is known by the person doing the work anyway, not by the planning tool.
- Treat compression as an exception. Fast tracking is a response to a specific deadline situation, not a planning style. Anyone who overlaps every plan to the maximum from the start has no lever left when things really get tight.
Conclusion
The three techniques start at different points: fast tracking at the sequence, crashing at the duration of individual activities, contouring at the utilisation. In practice you begin with contouring, because only a realistic work distribution shows which overlap actually holds. Fast tracking follows, crashing last, when budget is available and time is still short.
What matters is that logic and utilisation live in the same plan. Split across two tools, every compression remains guesswork. In Merlin Project you drag the overlap in the Gantt chart and read the consequence one view later in the work distribution, on Mac and iPad, even without a network connection. You can try it for 30 days free of charge.
If you want to know how likely the new deadline actually is, you will find the answer in the article on the Monte Carlo simulation in project management.
If you have any questions about this blog article or would like to discuss it, we look forward to your contribution in our forum.
Frequently asked questions
What is the difference between fast tracking and crashing?
Fast tracking runs activities in parallel that were planned in sequence. It costs no additional budget but increases the risk of rework. Crashing adds resources to activities on the critical path, leaves the sequence untouched and increases cost.
When should I not use fast tracking?
With mandatory dependencies that follow from the matter itself, such as curing times, legal deadlines or required approvals. Fast tracking is equally pointless on activities with float, because the project end does not move.
What does contouring mean in project management?
Contouring describes how the work of a resource is distributed across the duration of an activity. Instead of averaging the work across all days, the contour maps when the work actually happens, for example weighted towards the start, the end or the middle.
Which contours are there?
Common ones are the flat distribution, front-loaded with the emphasis at the start, back-loaded with the emphasis at the end, the bell shape with a peak in the middle and the double peak for activities with setup and teardown.
How much time can fast tracking gain?
That depends on the share of discretionary dependencies. In practice, overlaps of 20 to 40 percent of the activity duration are common. More important than the individual figure is to check the critical path after every overlap, because another chain often becomes critical.
Can Merlin Project apply work contours automatically?
No. Merlin Project currently has no work contour field and no predefined contours such as front-loaded or bell. An activity distributes its work evenly across the duration; utilisation applies to the entire assignment, not to individual days. You build a contour via the workaround of several sub-activities, each with its own work and duration values. The result is visible day by day in the Assignments view with the Work distribution layout.