Le modèle gratuit de feuille de route pour Merlin Project
Chaque année, tout manager devrait disposer d'un plan stratégique ou d'une feuille de route. Dans cet article, nous allons configurer un plan d'exemple pour Merlin Project et mettre en lumière les aspects temporels et financiers. La définition du contenu est ensuite votre affaire. Vous trouverez également ce projet dans notre espace de modèles en téléchargement gratuit.
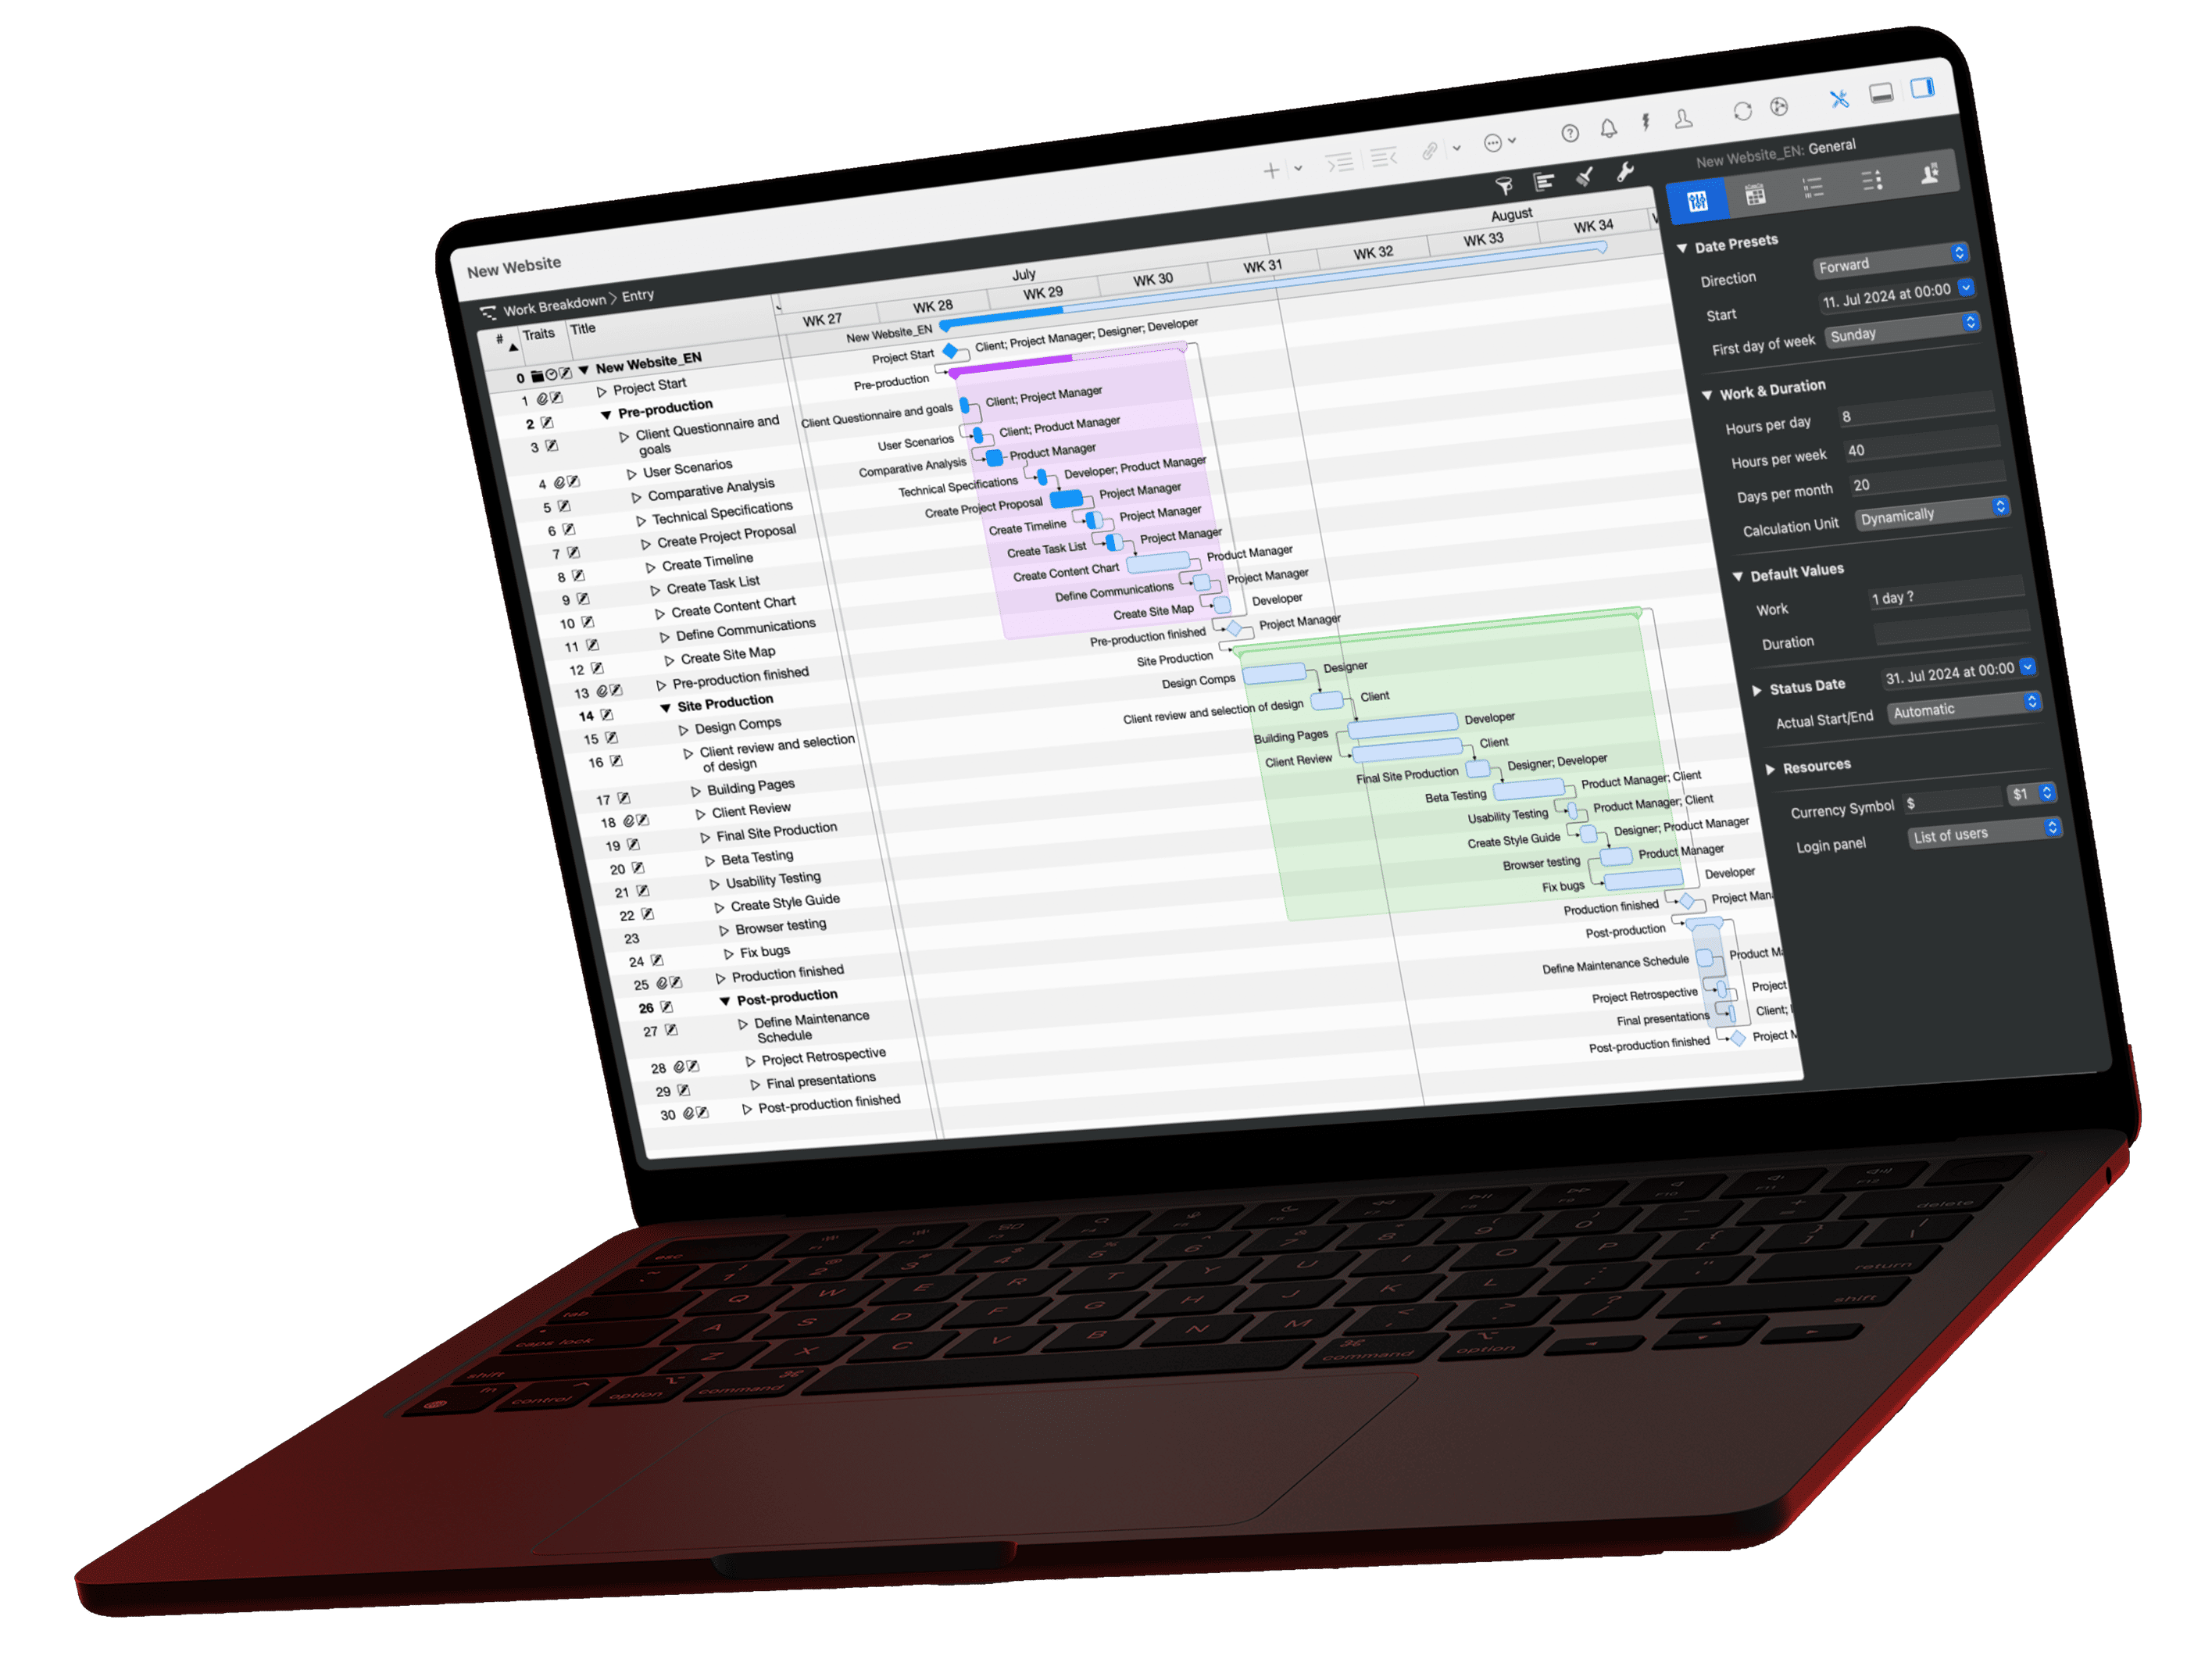
Le projet

Sur l'image ci-dessus, on remarque immédiatement que différents formats sont utilisés. Selon la tâche, des histogrammes, des barres, des jalons et des cases sont employés. Mais parcourons l'image de haut en bas.
La ligne de projet

Au lieu des crochets habituels indiquant les groupes et tâches subordonnés, nous avons intégré deux histogrammes. Le premier affiche les coûts attendus par unité de temps et le second présente ces coûts sous forme cumulée.

Pour appliquer la mise en forme, cliquez sur la barre de projet et sélectionnez [Style et contenu] > [Lignes] dans le menu contextuel. Dans l'inspecteur, le dernier onglet "Pour la sélection" doit être sélectionné ; c'est précisément ce que nous souhaitons : mettre en forme notre sélection. Commencez par basculer le type de ligne sur "Histogramme".
Vous pouvez maintenant attribuer des valeurs à jusqu'à trois lignes. Dans ce cas, nous avons seulement besoin des "Coûts attendus" deux fois. Pour ce faire, cliquez simplement sur la ligne correspondante dans la vue miniature et sélectionnez le contenu approprié. N'oubliez pas que le contenu de la deuxième ligne doit être cumulé.
Pour rendre la présentation un peu plus agréable à l'oeil, je règle toujours les décimales sur "0", car ces détails ne m'intéressent pas à ce niveau.
Les influences externes

Chaque nouvelle année apporte son lot de nouveautés pour l'entrepreneur, qui cherche à consigner les facteurs et échéances connus. J'aime pour cela utiliser des jalons qui, selon le sujet, indiquent le début ou la fin d'un événement. Gardez simplement à l'esprit que dans une vue annuelle comme ma feuille de route 2021, un jour de décalage n'a pas grande importance. C'est ce que l'on trouve dans les lignes n°1 à n°6. J'inclus la première ligne "Événement de l'année précédente" uniquement si cet événement joue un rôle stratégique pour nous en 2021. Pour ProjectWizards, ce fut par exemple la présentation des premiers produits équipés de la puce M1 d'Apple.
Que vous divisiez cela en différents groupes ou que vous saisissiez tout au niveau principal dépend de vos préférences personnelles. Le détail de l'image à droite montre comment activer les limites de groupe dans les paramètres de vue 🔧 .
Si vous souhaitez insérer un événement en tant qu'estimation temporelle approximative, créez simplement une nouvelle ressource nommée "(estimé)" et assignez-la à l'événement.
Les coûts de personnel
La ligne n°7 présente à son tour quelques particularités. Premièrement, ce n'est pas une ligne pure, mais un groupe qui possède lui-même un type de ligne spécial. Dans cet exemple, les coûts de personnel sont relativement constants, j'ai donc opté pour des "cases" avec des valeurs. Si vos coûts fluctuent beaucoup, par exemple parce que vous travaillez avec de nombreux prestataires externes ou des ressources changeant fréquemment, je choisirais à nouveau un histogramme.

La procédure est la même que pour la ligne de projet : sélectionnez la ligne "Coûts de personnel" et faites un clic droit dessus. Dans le menu contextuel qui apparaît, sélectionnez [Style et contenu] > [Lignes]. Dans l'inspecteur, le dernier onglet "Pour la sélection" est à nouveau sélectionné. Définissez maintenant le type de ligne sur "Case" et le contenu de la première ligne à nouveau sur "Coûts attendus".
Vous découvrirez le vrai atout en dépliant le groupe n°7. On trouve ici une tâche pour chaque mois, d'une durée d'un mois, avec les coûts de base engendrés par l'ensemble des employés durant ce mois. À titre d'exemple, j'ai simplement saisi 50 000 € pour janvier à août et 60 000 € à partir de septembre. Si vous le souhaitez, vous pouvez même décomposer davantage les coûts en ouvrant le groupe "Coûts de base" dans l'inspecteur et en saisissant des lignes individuelles, comme illustré à droite.
Le portfolio et la Recherche et Développement
J'ai listé les produits ainsi que les projets de R&D comme exemples dans les lignes n°20 à n°32. Dans l'esprit d'une feuille de route, je n'ai répertorié que les fonctionnalités importantes sous forme de jalons. Lorsqu'un lien avec un événement existe, une dépendance a été créée entre les deux ; par exemple, la "Fonction 3" du "Produit 1" (ligne n°24) devrait être prête pour l'Événement 1 (ligne n°2).
Ici aussi, vous devez décider vous-même si vous appréciez les limites de groupe ou non. Personnellement, je trouve l'encadrement coloré très utile. Cliquez sur l'image pour un affichage agrandi :


Projets externes et internes
Au-delà du seul développement produit, d'autres projets peuvent bien sûr être planifiés fermement dans l'année. Dans les lignes n°33 à n°39, j'ai créé quelques exemples de projets internes et externes. Ici également, des dépendances avec des événements ou le développement produit peuvent exister ; par exemple, le nouveau matériel présenté en février (ligne n°5) est ensuite immédiatement intégré dans l'entreprise (ligne n°37).
Campagnes marketing

Bien qu'une campagne marketing soit toujours un projet, nous avons à nouveau basculé sur l'histogramme dans le groupe (ligne n°40) et créé les lignes subordonnées comme campagnes individuelles (lignes n°41 à n°45). Ainsi, les coûts ont pu être saisis comme coûts de base, qui s'intègrent bien sûr automatiquement dans les coûts du projet et donc dans l'histogramme de la ligne de projet (ligne n°0).
Sur les captures d'écran de la feuille de route, vous aurez sans doute remarqué qu'une description s'affiche parfois à gauche d'une phase temporelle, c'est-à-dire de l'histogramme ou des cases. Vous l'activez dans les paramètres de vue 🔧 .
Aussi sur iPad
Si vous sauvegardez votre feuille de route ou planification stratégique sur un stockage cloud comme iCloud ou Dropbox, vous aurez également le projet sous la main rapidement dans Merlin Project sur iPad.

Et maintenant, quelle est la suite ?
Notre exemple s'arrête ici. Mais pour vous, le travail ne fait que commencer, car plusieurs extensions sont encore envisageables :
- Une gestion complète des risques pour l'année. À titre d'exemple, j'ai joint un premier risque aux coûts de personnel.
- Le volet recettes peut encore être intégré, ce à quoi j'ai renoncé ici.
- Les projets clients peuvent être externalisés en tant que projets indépendants.
Et surtout : lorsque l'année sera lancée, saisissez les données réelles. Il sera ainsi très intéressant de voir quand Apple présentera les appareils Pro avec la puce M1.
Pour finir, un dernier conseil : si vous sélectionnez un fichier de projet dans le Finder et appuyez sur la barre d'espace, le contenu du fichier s'affiche dans un aperçu. Tout comme notre feuille de route :

Si vous avez des questions sur cet article de blog ou si vous souhaitez en discuter, nous attendons avec impatience votre contribution dans notre forum.