Gestion de Projet avec une Touche de Magie
Planifiez, pilotez et livrez vos projets efficacement. Merlin Project pour macOS et iOS

Si vous devez passer en revue une grande quantité d'informations similaires et que vous risquez de perdre de vue l'ensemble, il vous est utile de les visualiser à l'aide d'une matrice à quatre champs afin de pouvoir les évaluer plus facilement.
Pour ce faire, organisez-les dans une croix d'axes en 2 dimensions. Bien entendu, quatre champs ne peuvent résoudre tous les problèmes, mais ils présentent de nombreux avantages:
Il existe divers exemples d'utilisation d'une matrice à quatre champs:
Priorisation de projet
Matrice Eisenhower
Matrice des parties prenantes
Matrice des risques
Analyse SWOT
Matrice Ansoff
Analyse de portefeuille
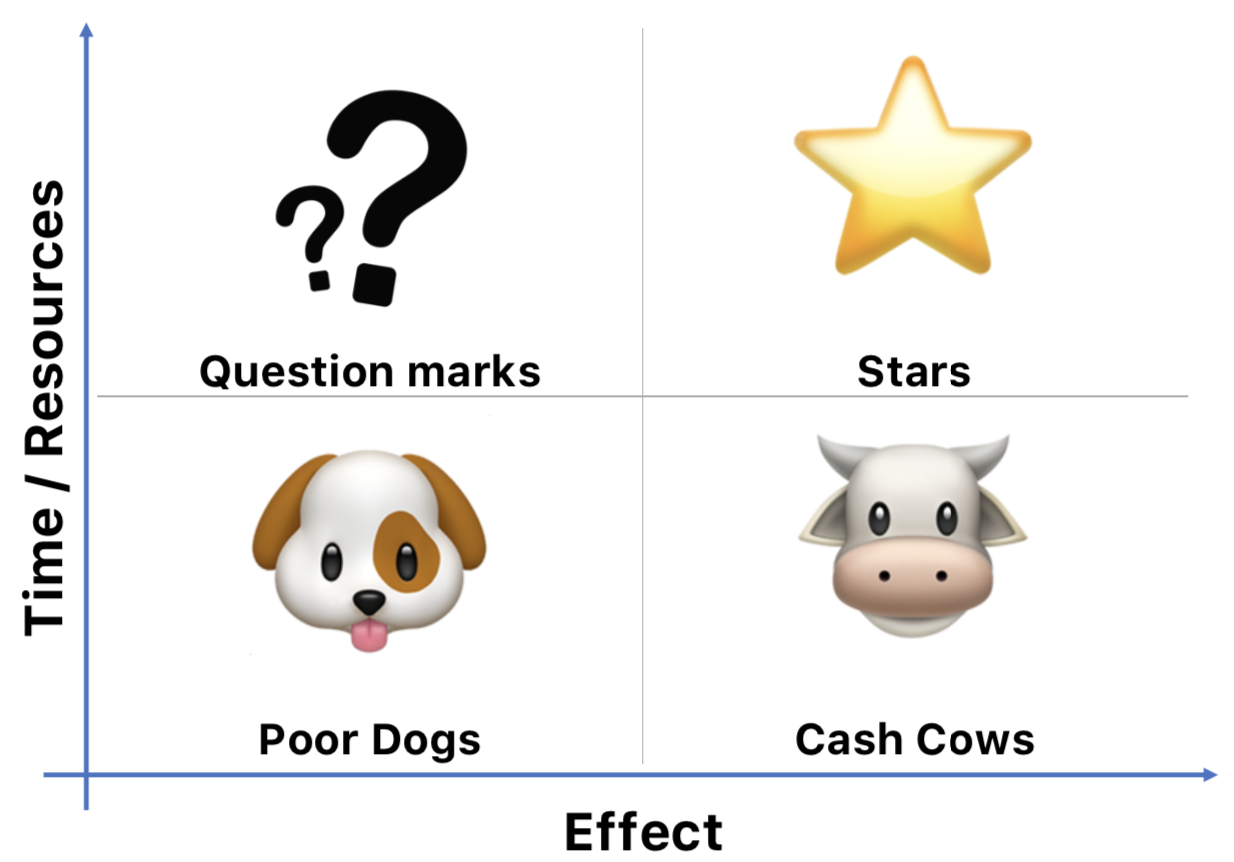
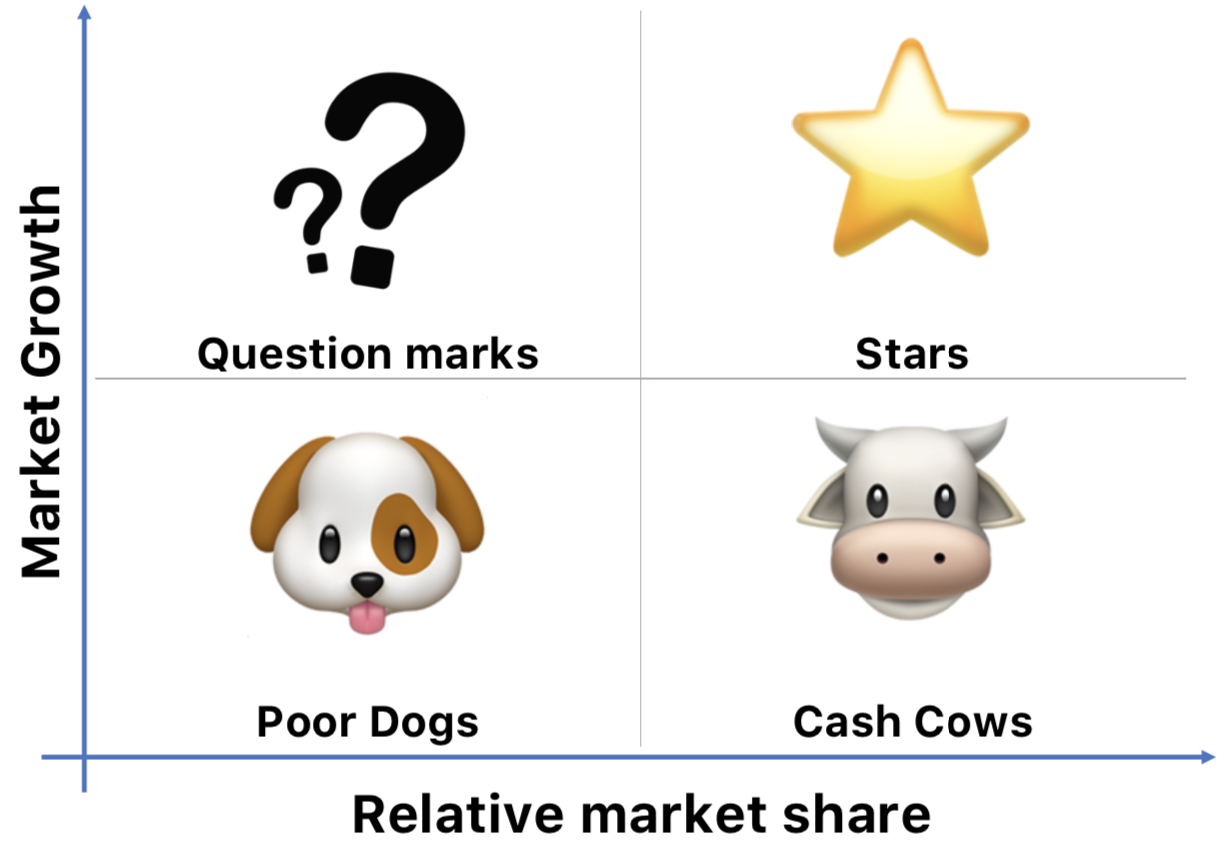
Une simple matrice à quatre champs constitue une bonne base pour évaluer les projets. Les ressources nécessaires sont liées aux effets attendus. Les projets sont classés en vaches à lait, étoiles, poids morts ou dilemmes.
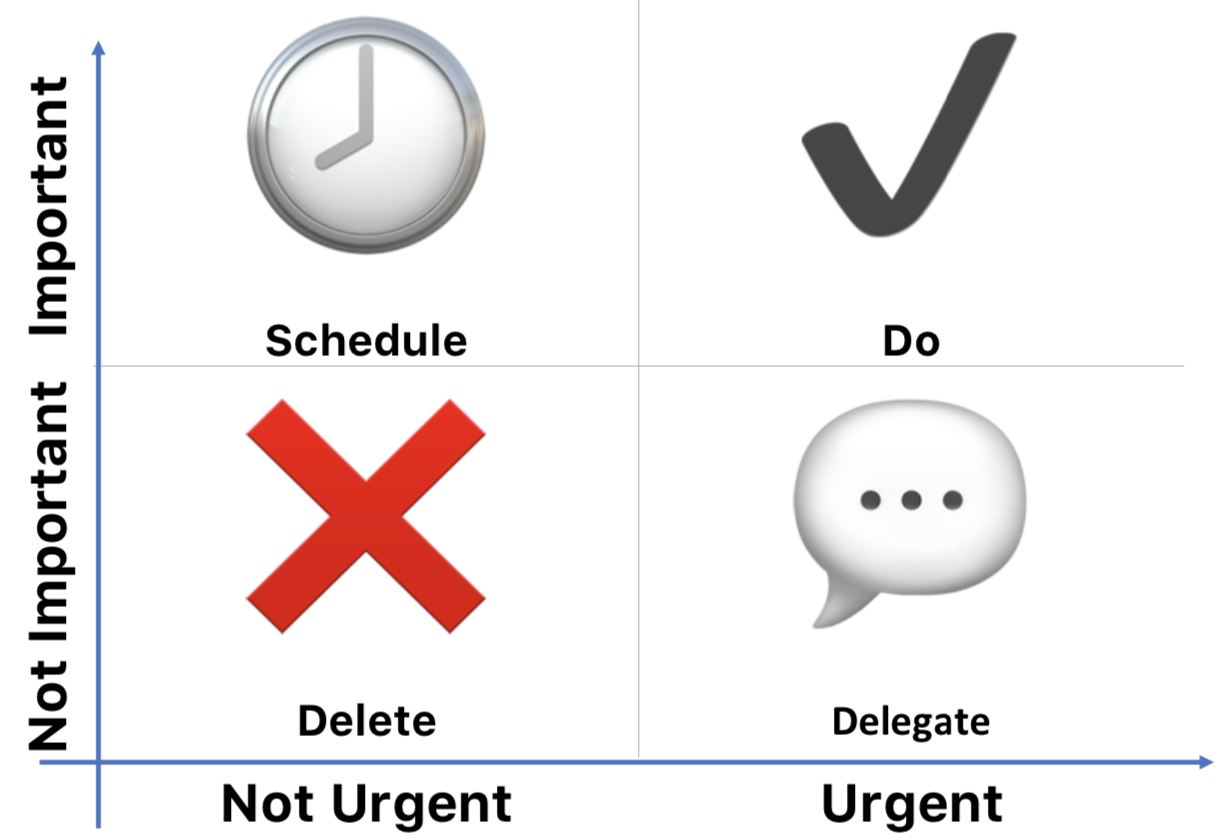
L'une des références en gestion du temps est la matrice Eisenhower. Elle compare l'importance et l'urgence. Les tâches sont hiérarchisées selon ce qui est important et ce qui ne l'est pas, urgent et non urgent.
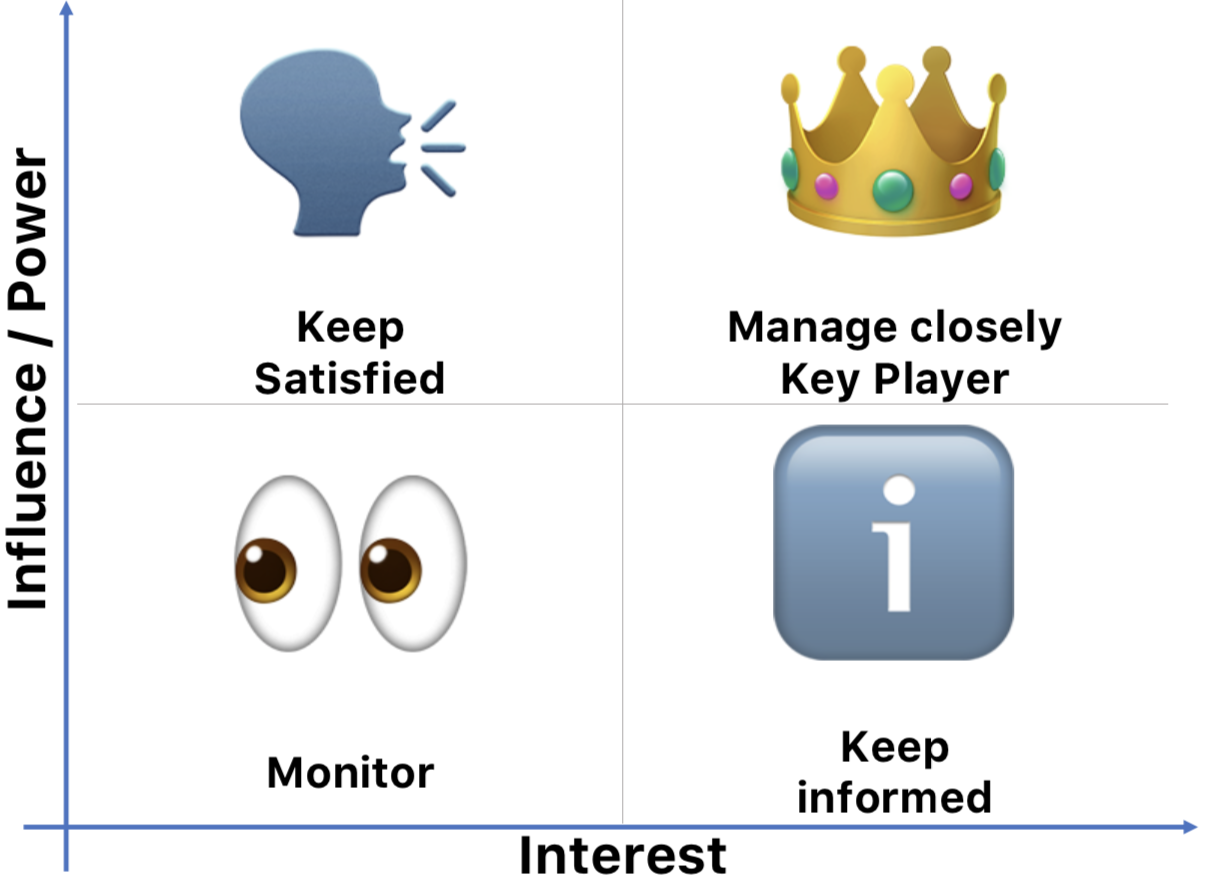
L'analyse ou la matrice des parties prenantes identifie les parties prenantes les plus importantes pour un projet, un programme ou le développement d'un produit, en tenant compte de leurs intérêts, de leur pouvoir, de leur attitude et de leur influence. La matrice des parties prenantes visualise ces acteurs les uns par rapport aux autres, en prenant en compte leur influence et leur intérêt.
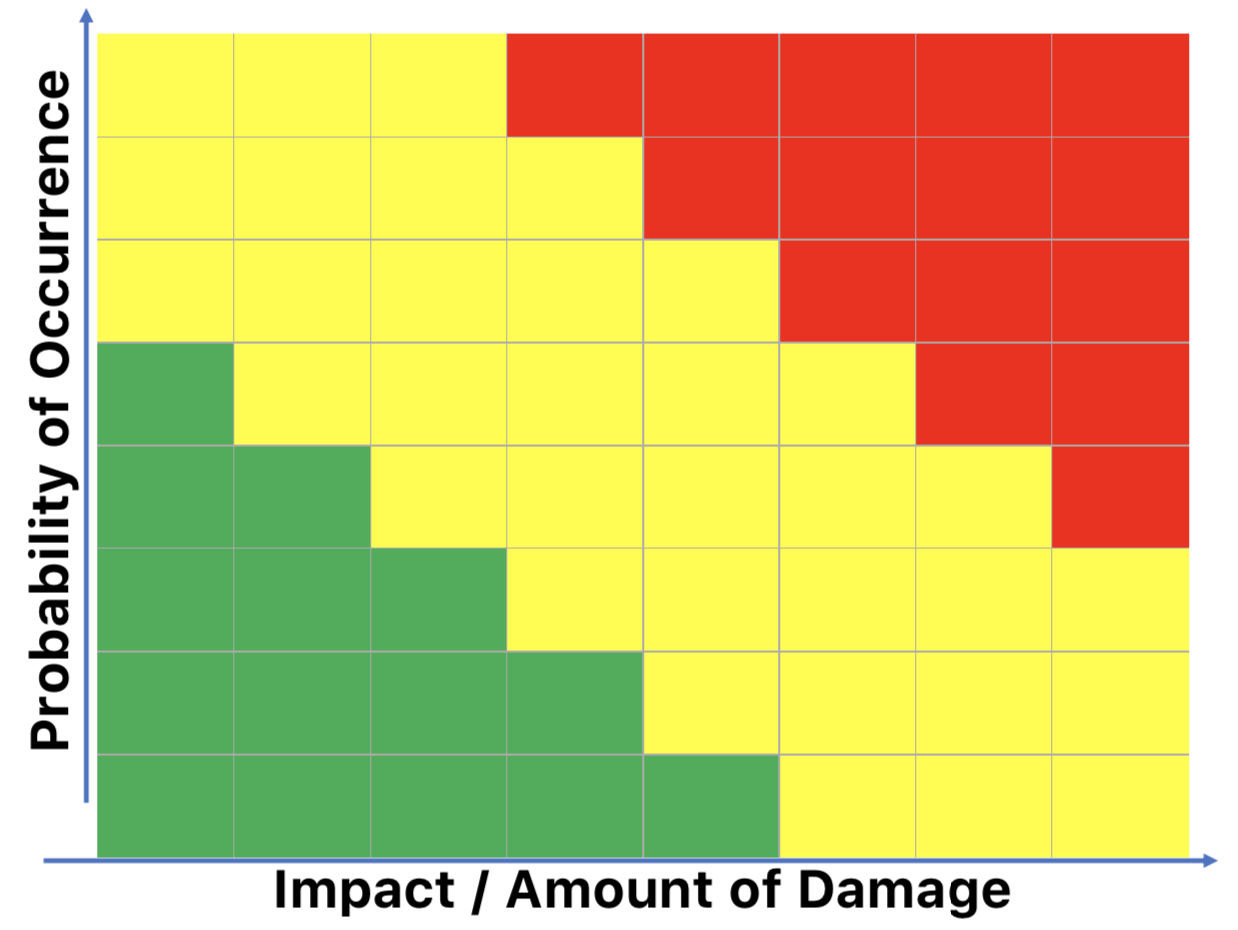
Ce qui s'applique aux parties prenantes s'applique également aux risques. Vous obtenez une vue d'ensemble claire de la situation des risques de votre projet en comparant la probabilité d'occurrence aux effets des risques.
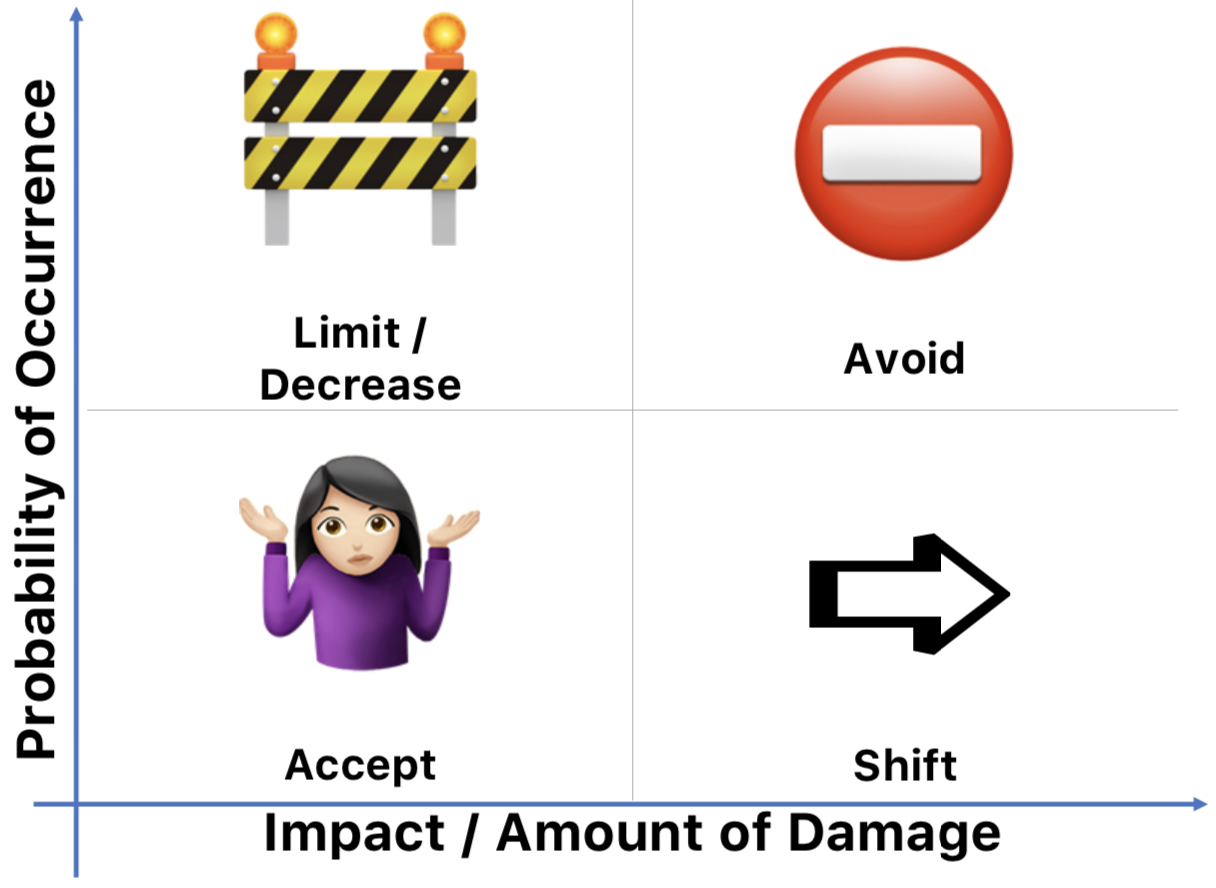
Plus la structure de la matrice est fine, meilleure est la vue d'ensemble. Souvent, on utilise les couleurs vert (faible probabilité et faibles effets) et jaune à rouge (forte probabilité et grands effets) pour l'affichage.
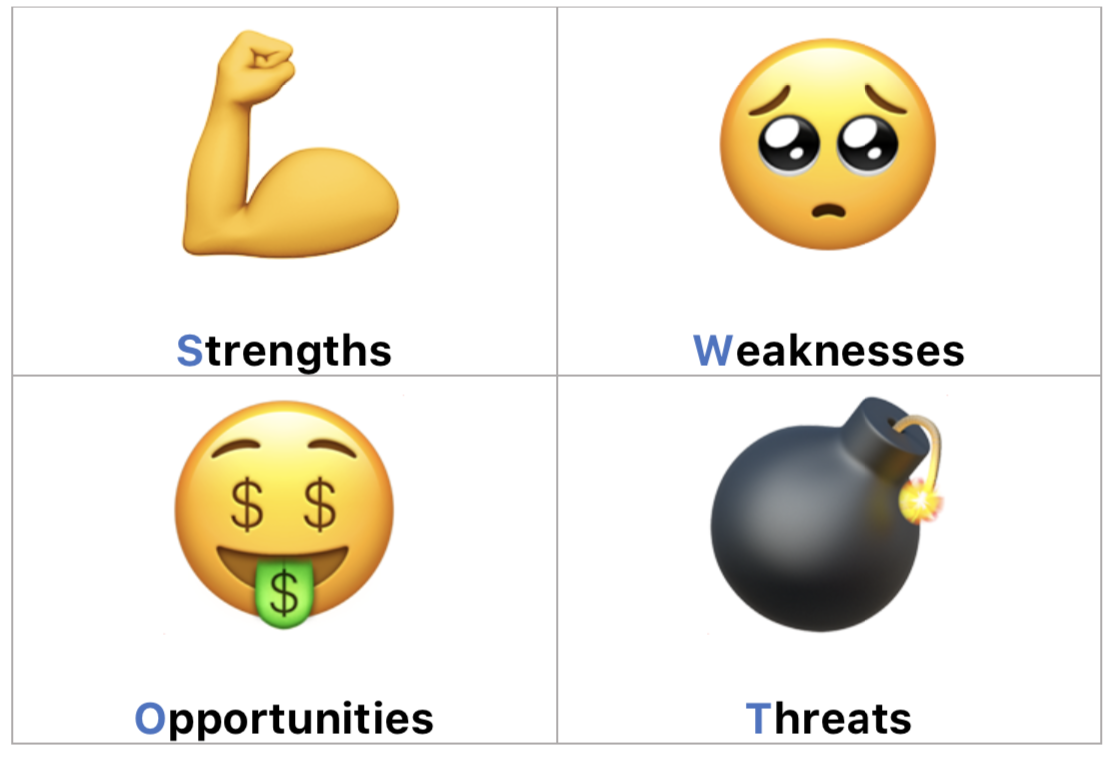
L'analyse SWOT aide à dresser un portrait de l'entreprise ou de l'équipe projet. Les Forces, Faiblesses, Opportunités et Menaces sont réparties dans une matrice.
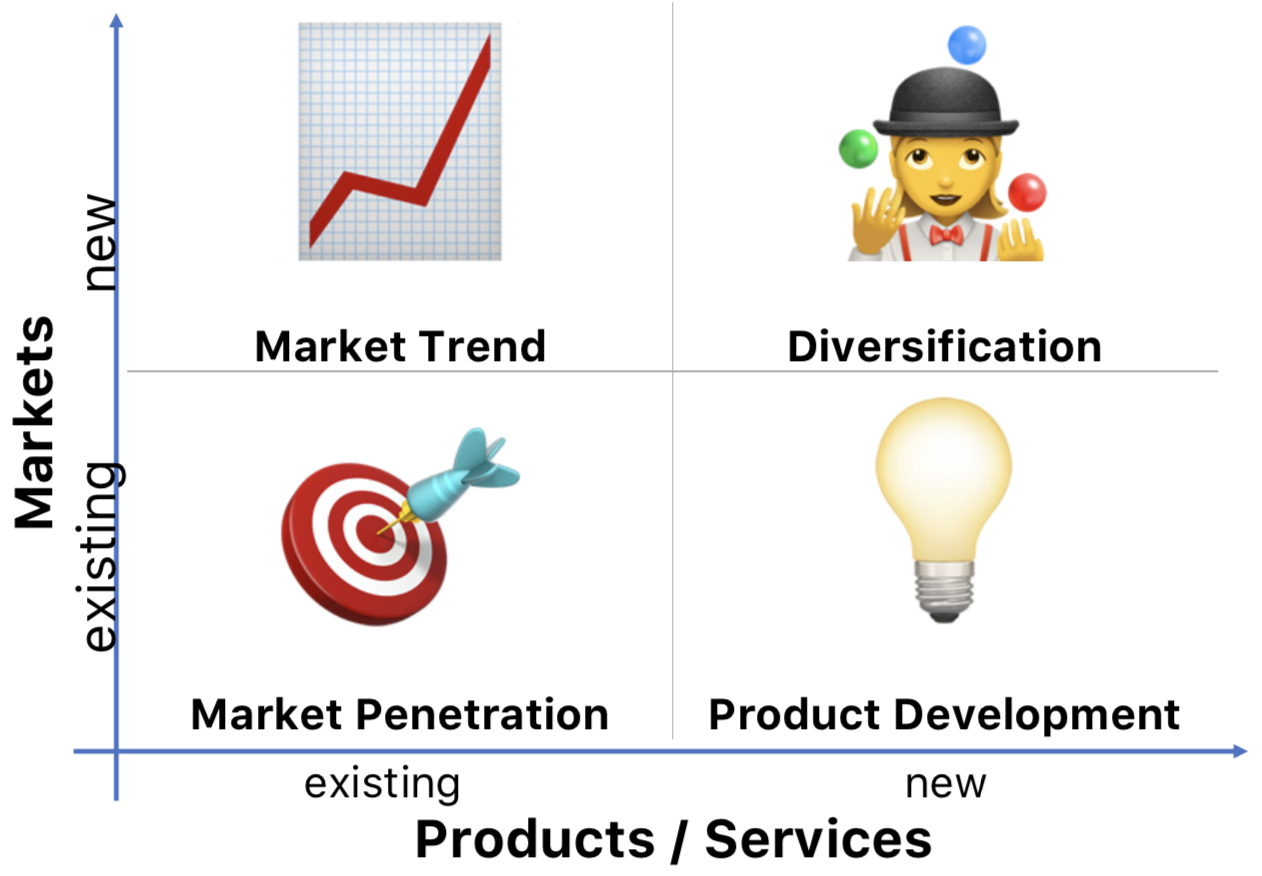
Avec la stratégie produit-marché ou matrice Ansoff, les marchés et les produits sont examinés de près et présentés de manière visuelle. Ainsi, les décideurs peuvent élaborer une stratégie d'avenir axée sur la croissance pour leur entreprise.
L'analyse de portefeuille du Boston Consulting Group (matrice BCG) également connue sous le nom de matrice de croissance-part de marché, utilise la même comparaison que pour la priorisation de projet, mais en tire des conclusions pour la stratégie d'entreprise future. Les produits sont classés selon leur cycle de vie dans les quatre catégories : vaches à lait, étoiles, poids morts ou dilemmes et la part de marché relative ainsi que la croissance du marché sont prises en compte.
Bien entendu, les quatre champs ne peuvent pas résoudre tous les problèmes. Parfois, il est même plus judicieux de travailler avec davantage de champs pour obtenir une vue d'ensemble encore plus précise. Cependant, une matrice représente des faits complexes de manière simple et constitue un bon point de départ pour des analyses plus approfondies.
Vos idées, notre magie – Réalisez vos projets en toute simplicité!
Essayez maintenant gratuitement pendant 30 jours.
