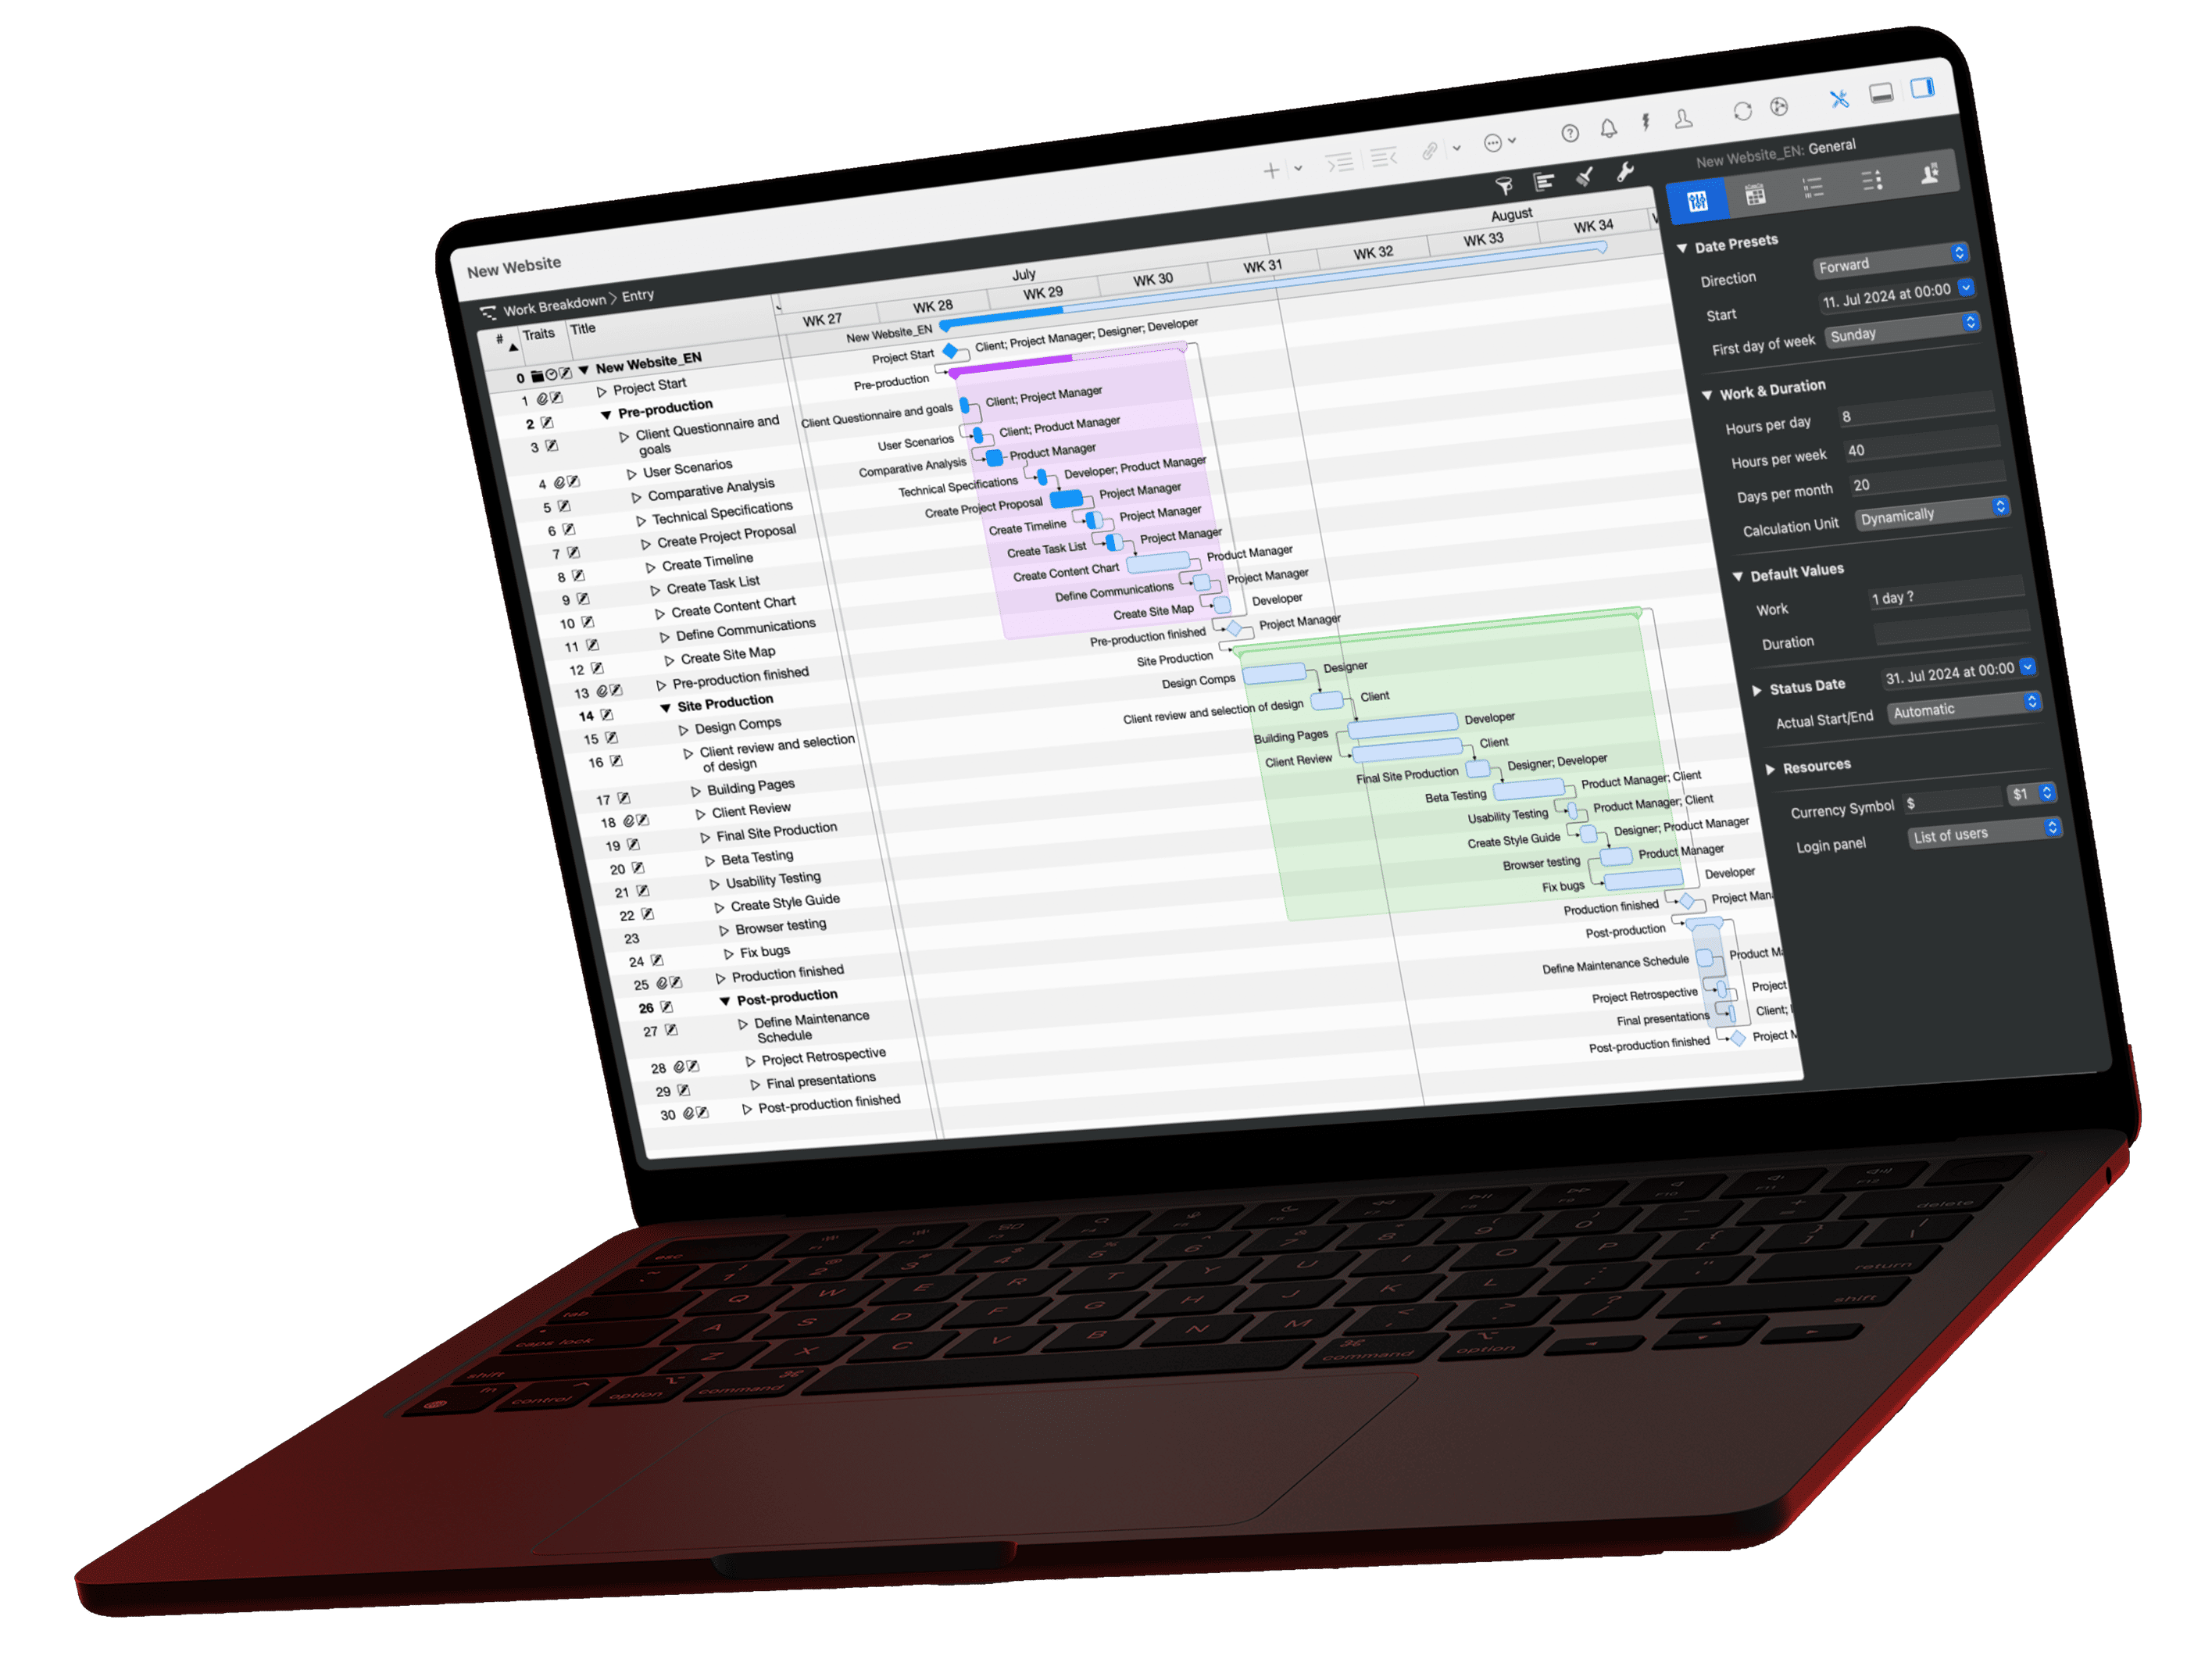
Macs are considered expensive, Windows PCs cheap. But the purchase price is only the beginning: once you factor in residual value, IT support, software and energy, the picture often changes. Use our interactive calculator to compare the total cost of ownership (TCO) yourself; with the price of your own device, if you like.
Updated 10 September 2026: Apple raised the prices of the iPhone 17 line on 9 September; the iPhone 17 with 256 gigabytes now costs 899 US dollars instead of 799 (1,099 euros instead of 949), and the figures in the conclusion have been updated. New in the calculator: an arrow next to the device name opens further models in four categories: iPhone 17e, iPhone 18 Pro and the foldable iPhone Duo against the Galaxy Z Fold 8, the MacBook Pro with M5 Pro and M5 Max, Mac mini M5 Pro and Mac Studio, plus iPad Air and iPad Pro, each with a counterpart. The overview at the end of the article still uses the standard devices.
Run the Numbers Yourself
TCO Calculator: Apple vs. Windows
Include software licenses
Nothing is preselected. The calculator starts with the devices alone; licenses are added as soon as you tick a row.
Adjust assumptions
- Purchase
- Residual value (resale)
- Operating system license
- IT support
- Energy
- Total cost of ownership
- Purchase
- Residual value (resale)
- Operating system license
- IT support
- Energy
- Total cost of ownership
Choose a device category, adjust the purchase prices if you like (for example to the price of your own device) and set the planned period of use, anywhere from one to ten years. If an arrow appears next to the device name, that side of the category carries more than one model: pick the iPhone 17e instead of the iPhone 17 there, say, or the MacBook Pro with M5 Max. The other side jumps to the matching model automatically, so the iPhone Duo brings up the Galaxy Z Fold 8. Pitting two arbitrary devices against each other is deliberately possible only through the price fields. Which software licenses belong in your calculation, you decide in the section above; none are preselected. For tablets and smartphones that section disappears, because the licenses apply to desktop software only.
Under Adjust assumptions sit the items themselves. Residual value, operating system license, IT support and energy can each be switched off or recalculated with your own figures. Three presets do that for you:
- Standard uses the assumptions this article documents.
- Conservative drops the residual value and sets the ticket volume equally high on both sides.
- Purchase price only leaves out every follow-up cost and compares acquisition alone.
The line below the result always states which assumptions are in force.
The purchase price is only half the story. The total cost of ownership (TCO), the full cost over the entire period of use, also covers operating system licenses, IT support, energy consumption and the residual value at resale. How the calculator prices each of these items, and where the figures come from, is what the sections below explain.
The research supports that view. This article was prompted by the TCO comparison by Jamf, which summarizes it. The best-known figure comes from IBM: the company manages more than 200,000 Apple devices and puts the savings at 273 to 543 US dollars per Mac over its lifecycle. Forrester Consulting's Total Economic Impact study arrives at average savings of 843 US dollars per Mac over three years; the 2024 update found an ROI of 186 percent with payback in under a year.
How the Calculator Works
Total cost of ownership
- Purchase one-time
-
Residual value (resale)
falls over time
max( Purchase × rn / 3, Purchase × f ) - Operating system license one-time
-
IT support
per year
t × k × n -
Energy
per year
kWh × p × n -
Software licenses
per year or one-time
annual amount × n + one-time amount
n = period of use in years, r = residual rate after three years, f = floor, t = tickets a year, k = cost per ticket, p = electricity price per kilowatt-hour
Residual value is the only item that does not run in a straight line. It falls exponentially and is caught by the floor. That is exactly why the result moves as soon as you drag the period-of-use slider: the running items grow while the deduction shrinks. Floor: 5 percent of the purchase price for computers, 8 percent for mobile devices.
The residual value follows a depreciation curve derived from the documented residual value after three years. A shorter period of use therefore yields a higher resale return, a longer one a lower return, bounded by a floor of 5 percent of the purchase price for computers and 8 percent for mobile devices. Without that floor, the curve would end up at figures no commercial buyer would confirm.
Four rules govern the numbers behind it.
- When in doubt, against Apple. Wherever the evidence gives a range, the figure less favourable to Apple goes into the calculator: Mac residual values at the bottom of the range, Windows residual values at the top, the ticket ratio well below the documented one. If Apple still comes out ahead under that calibration, the result holds.
- A primary source, or two independent analyses. Every assumption needs a vendor price list or official statistics, failing that at least two independent analyses with a disclosed method. Vendor blogs and comparison sites may corroborate a figure but never carry it alone.
- Median rather than mean. Wherever several values exist, the median counts.
- Source, retrieval date and classification for every figure. The sections that follow name them one by one.
The Device Prices
What counts is the price in the vendor's own official channel, meaning the amount a buyer actually pays there. The starting values are US prices excluding tax, as of July 2026, as of 31 August 2026 for the Mac mini and as of 10 September 2026 for the smartphones. The rows marked "further models" list the devices you can select in the calculator via the arrow next to the device name.
| Category | Apple | Windows or Android |
|---|---|---|
| Entry-level laptop | MacBook Neo, $699 | ThinkPad E16 Gen 3, $963 |
| Business laptop | MacBook Air 13, $1,299 | ThinkPad L14 Gen 7, $1,439 |
| Pro laptop | MacBook Pro 14, $1,999 | Dell XPS 14, $1,690 |
| Pro laptop, further models | MacBook Pro 14 M5 Pro, $2,499; MacBook Pro 16 M5 Pro, $2,999; MacBook Pro 16 M5 Max, $4,399 | HP ZBook Ultra G1a 14, $4,299; ThinkPad P1 Gen 8, $3,200; ThinkPad P16 Gen 3, $5,569 |
| All-in-one desktop | iMac 24, $1,499 | HP OmniStudio X 27, $1,500 |
| Compact desktop | Mac mini, $899 | Dell Pro Micro, $929 |
| Compact desktop, further models | Mac mini M5 Pro, $1,699; Mac Studio M5 Max, $2,499 | Dell Pro Micro Plus, $2,008; HP Z2 Mini G1a, $4,149 |
| Tablet | iPad 11, $449 | Galaxy Tab S10 FE, $550 |
| Tablet, further models | iPad Air 11, $749; iPad Pro 11, $1,199 | Galaxy Tab S11, $700; Galaxy Tab S11 Ultra, $950 |
| Smartphone | iPhone 17, $899 | Samsung Galaxy S26, $900 |
| Smartphone, further models | iPhone 17e, $699; iPhone Duo, $1,999; iPhone 18 Pro, $1,199 | Galaxy S26 FE, $800; Galaxy Z Fold 8, $1,650; Galaxy S26 Ultra, $1,300 |
On the Apple side these are the prices following the price increase of June 2026, cross-checked against Apple's own comparison page. The Mac mini has carried the M6 chip since 25 August 2026, the M4 model is discontinued; the price rose by 100 in both currencies while the base configuration stayed at 16 gigabytes and 256 gigabytes. For the smartphones, the current base models meet with identical storage, iPhone 17 and Galaxy S26, both with 256 gigabytes. Since 10 September the iPhone 17 stands in the calculator at the price after Apple's increase of 9 September 2026, 899 instead of 799 US dollars. The figure is confirmed in the Apple Store.
Facing them is a device of the same class from the business range: ThinkPad E16 Gen 3, ThinkPad L14 Gen 7, Dell XPS 14, HP OmniStudio X 27, Dell Pro Micro and Galaxy Tab S10 FE.
Not the list price, but what you actually pay. For three of these machines, the table deliberately does not carry the recommended price. Dell states a value of 1,999.99 US dollars for the XPS 14 and sells it at 1,689.99; for the Pro Micro, 1,338.59 stands against an actual 928.59, a full 30 percent below; Lenovo sells the E16 at 963.30 instead of 1,014 US dollars with the current promotional coupon. Gaps like these are permanent at several Windows vendors, while Apple's list price is also its street price. Comparing two list prices would therefore systematically make the Windows side look too expensive. What is entered is what you actually pay at the vendor, which sets the Windows devices on the cheap side rather than the dear one.
Further models in four categories. Since 10 September the calculator carries more than one model per side for the pro laptop, the compact desktop, the tablet and the smartphone; an arrow next to the device name opens the selection, and the other side follows automatically. The overview at the end of the article and the statements in the conclusion still refer to the standard pairs in the table. We read the prices of the additional models in the manufacturers' stores on 10 September.
- iPhone 17e versus Galaxy S26 FE, both with 256 gigabytes: 699 US dollars (849 euros) after the price increase of 9 September against 799 US dollars (899 euros) at Samsung. Both take residual value, support and consumption from the smartphone category.
- iPhone 18 Pro versus Galaxy S26 Ultra, both with 256 gigabytes: 1,199 US dollars (1,449 euros) for the 18 Pro, on pre-order from 12 September, against 1,299.99 US dollars (1,449 euros) for the S26 Ultra.
- iPhone Duo versus Galaxy Z Fold 8, both with 256 gigabytes: 1,999 US dollars and 2,299 euros for the Duo, on pre-order from 16 October and shipping from 23 October, against 1,649.99 US dollars actually charged at Samsung (list price 1,899.99) and 1,999 euros for the Fold 8; the pricier Fold 8 Ultra would have been the opponent more favourable to Apple. For foldables the calculator applies its own residual values, 30 instead of 40 percent for the iPhone and 20 instead of 28 percent for the Galaxy: SellCell measures 34 percent residual value after twelve months for Samsung foldables against 46 percent for the Galaxy S series, and we carried that ratio over to both sides. For the Duo, buyback values naturally do not exist yet. The sign of the result hinges on that residual value, which you can change under Adjust assumptions.
- MacBook Pro 14 with M5 Pro versus HP ZBook Ultra G1a 14: 2,499 US dollars (2,899 euros) in the Apple Store for 24 gigabytes and 1 terabyte; Apple's June increase also hit the Pro and Max models. Opposite it stands the ZBook with Ryzen AI Max Pro 385, 32 gigabytes and 512 gigabytes at 4,299 US dollars in the HP store and 2,364 euros in Germany, where HP sells it through Amazon.
- MacBook Pro 16 with M5 Pro versus ThinkPad P1 Gen 8: 2,999 US dollars (3,399 euros) against 3,200 US dollars in the Lenovo store for 32 gigabytes and 1 terabyte, and 4,924 euros in Germany, where Amazon charged 3,138 euros for the same configuration on the same day; by our pricing rule the manufacturer's channel counts. The P1 ships with Windows 11 Pro, so the license item drops out.
- MacBook Pro 16 with M5 Max versus ThinkPad P16 Gen 3: 4,399 US dollars (5,099 euros) for 36 gigabytes and 2 terabytes against 5,569 US dollars in the Lenovo store for Core Ultra 7, 64 gigabytes, 2 terabytes and RTX Pro 2000; in Germany the same machine with 1 terabyte costs 3,714 euros, the 2 terabyte price will follow. Both take consumption and residual value from the category, which flatters the RTX workstation.
- Mac mini M5 Pro versus Dell Pro Micro Plus: 1,699 US dollars (1,999 euros) for 24 gigabytes and 512 gigabytes against 1,846 euros in the Dell store for Core Ultra 7, 32 gigabytes and 1 terabyte, 2,008 US dollars in the US store.
- Mac Studio M5 Max versus HP Z2 Mini G1a: 2,499 US dollars and 2,999 euros for the Studio with 36 gigabytes and 512 gigabytes, shipping from 22 September, against 2,578 euros in the HP store for Ryzen AI Max Pro 390, 32 gigabytes and 1 terabyte, 4,149 US dollars in the US store.
- iPad Air 11 versus Galaxy Tab S11, both with 128 gigabytes, Wi-Fi: 749 US dollars (799 euros) against 699.99 US dollars (819 euros) at Samsung.
- iPad Pro 11 versus Galaxy Tab S11 Ultra, both with 256 gigabytes, Wi-Fi: 1,199 US dollars (1,299 euros) against 949.99 US dollars (1,069 euros); the 5G version of the Ultra, sold in Germany only, stays out because the iPad Pro is also the Wi-Fi model.
Where we fall back on the trade press or dealers instead of the manufacturer for the additional models, it says so here; the calculator's maintenance file records each of these points as an open check. This selection remains a judgment call, which is exactly why both price fields in the calculator are freely editable. Enter what you actually pay.
Why IT Support Costs Less
The calculator assumes 0.8 tickets a year for a Mac and 2.0 for a Windows device, each at 13 US dollars. Over four years that is roughly 42 against 104 US dollars, a difference of just over 60 US dollars per workplace.
The rate of 13 US dollars deliberately applies to both platforms alike. It comes from the HDI benchmark, which reports anywhere from 6 to over 40 US dollars depending on channel and organisational maturity; we calculate in the lower third of that range. That a Mac ticket less often needs an on-site visit or a hardware swap would argue for a lower figure on the Apple side, but support is internal working time, and an hour of it costs the same whichever device is on the desk. The difference therefore comes from ticket volume alone.
And that volume is considerably larger in practice than what we apply. IBM reported that 5 percent of Mac users contact the help desk against 40 percent of PC users, a ratio of one to eight. The calculator uses one to 2.5. IBM is a single, very large organisation with a mature Mac practice, and that result cannot be transferred unchecked to smaller ones; the cut costs the Apple side most of the support advantage it could claim.
That Macs generate fewer cases at all comes down to vertical integration. Apple develops chip, device and operating system together and keeps the product line small. IT deals with few, well-documented hardware variants, driver conflicts are rare, and system updates reach every device at the same time. In the Windows world, by contrast, many vendors, chipsets, driver revisions and preinstalled OEM software meet, multiplying the number of possible failure modes. Add the self-sufficiency effect: at IBM, only 5 percent of Mac cases required an on-site appointment, compared with 27 percent for Windows. In the end, 7 administrators sufficed for the Mac fleet while the Windows fleet tied up 20.
For tablets and smartphones we halved the ticket volume (0.3 versus 0.6 per year) while keeping the ratio between platforms. Mobile devices simply generate fewer cases in daily operation than workstations.
Why Energy Consumption Is Lower
The calculator multiplies the annual consumption per device by the commercial electricity price in your market: a MacBook Air 13 with M5 draws around 22 kilowatt hours a year against 42 for a comparable ThinkPad, both calculated over 2,000 operating hours. The gap is wider for desktops and stays in the single digits for tablets and smartphones. In fairness, this item moves the overall result least of all. Over four years it amounts to double-digit sums depending on category, not three-digit ones.
That consumption diverges this far at all is a purely technical effect: Apple's M-series chips are ARM-based systems on a chip, with processor, graphics and memory in a single package. That shortens signal paths, lowers voltage and delivers far more compute per watt than classic x86 laptop platforms. Forrester puts the effect at around 75 percent lower energy demand for Macs with M-series chips compared with equivalent PCs; for Intel Macs it was still 50 percent.
The consumption figures themselves come from Apple's product environmental reports, which state power draw measured under the ENERGY STAR procedure: 3.69 watts idle with the display on, 0.24 watts in sleep. Getting from watts to an annual figure is one multiplication, worked through here for the standard laptop:
| Step | MacBook Air 13 (M5) | ThinkPad L14 Gen 7 |
|---|---|---|
| Idle with display | 3.69 W (Apple, ENERGY STAR) | about 7 W (estimate) |
| Assumed in mixed use | 11 W | 21 W |
| Operating hours per year | 2,000 | 2,000 |
| Annual consumption | 22 kWh | 42 kWh |
| Electricity cost over four years at 0.142 US dollars per kWh | about 12 US dollars | about 24 US dollars |
On both sides the mixed-use figure sits at roughly three times the idle value, because a working day adds browsers, video calls and compute load. Sleep stays out of it: 0.24 watts across the remaining 6,800 hours a year comes to less than two kilowatt hours and disappears in the rounding.
No such measurements exist for the Windows side, where the figures are estimated from the power draw of the platform used. That is the weakest piece of evidence in the whole calculator, and also the one carrying the least weight. The assumption stays conservative even so: Forrester's 75 percent lower energy demand would put the Windows side at four times the Mac, whereas the calculator uses 1.2 to 2.6 times depending on category. For the Mac mini we still use the environmental report of its M4 predecessor, because Apple has not published one for the M6 yet. The M6 is built on a 2-nanometer process, the M4 on 3, so the figure we carry over sets the Apple side too high rather than too low.
The electricity price, by contrast, is stored per target market, because it is the one item that does not translate through an exchange rate. According to Eurostat, German companies pay 0.2264 euros per kilowatt hour, French ones 0.16 and Spanish ones 0.12; in the US it is around 13.5 cents per the EIA forecast, with Japan and China in between. The same Mac therefore costs nearly twice as much to run in Germany as in China. A single US figure, merely converted for Europe at the exchange rate, would understate German energy costs by about a third.
Why the Residual Value Is Higher
For computers the calculator uses 22 to 28 percent of the purchase price for Apple devices after three years depending on category and 13 to 17 percent for Windows devices, with tablets and smartphones sitting higher; for shorter or longer periods it derives the figure from there via a depreciation curve. What counts is the price a commercial buyer pays, not the classified-ad price.
Values as a table
| Period of use | MacBook Air 13 | ThinkPad L14 Gen 7 |
|---|---|---|
| 1 years | 63 % | 53.1 % |
| 2 years | 39.7 % | 28.2 % |
| 3 years | 25 % | 15 % |
| 4 years | 15.7 % | 8 % |
| 5 years | 9.9 % | 5 % |
| 6 years | 6.3 % | 5 % |
| 7 years | 5 % | 5 % |
| 8 years | 5 % | 5 % |
| 9 years | 5 % | 5 % |
| 10 years | 5 % | 5 % |
Residual value as a percentage of the purchase price. The curve is calibrated on the documented three-year value; the floor catches it because no commercial buyer pays less than that. On the ThinkPad it takes effect from year five, on the MacBook Air from year seven.
The decline is exponential, not linear: a device loses most of what it will ever lose in the first year, after which the curve flattens out. In practice that means selling early rarely pays off, while every year from the fourth on barely moves the residual value any further. In the end the curve hits the floor: on the ThinkPad L14 from year five, on the MacBook Air from year seven.
Buyer price or classified-ad price: that distinction decides the order of magnitude of the entire item. Look at the consumer market and MacBooks come in at 50 to 60 percent after three years. Look at how entire corporate fleets are disposed of and you land at single-digit percentages for retired PCs. Both are true, but they measure different markets, and a business calculation needs the second one: companies do not sell device by device through classified ads, they sell to commercial buyers and refurbishers.
The Forrester study on Mac in the enterprise reports 25 percent after three years. Since Apple commissioned it, we treat that figure as a lower bound rather than an average. The Windows side, conversely, sits at the top of the usual comparison values, well above what disposal statistics suggest.
The residual value sits with each category rather than with the device group as a whole. A business ThinkPad holds up noticeably better in the refurbished market than a consumer device in the same price bracket, and a pro laptop better than an entry model. A single blanket figure for all computers would be open to challenge on precisely this point.
This is driven by three effects. First, the long software support: Apple typically supplies Macs with new macOS versions for seven years and more, so a used device stays productive. Second, the narrow product line, which creates a transparent second-hand market with stable prices, whereas Windows models are replaced annually in countless configurations. Third, plain demand: there is an established pool of buyers for used Macs, and hardly any for three-year-old business laptops.
With smartphones the gap is smaller but still clear. After two and a half years an iPhone holds around 48 percent of its value against about 30 percent for a Samsung flagship, as determined by The Whiz Cells. Because those too are consumer prices, the calculator sits below them at 40 versus 28 percent after three years, and 35 versus 22 for tablets.
Why the Operating System License Matters
The amount follows the individual device. Where Windows 11 Pro comes preinstalled, the line reads zero, because paid is paid; that covers the ThinkPad L14 and the Dell Pro Micro. Where the device ships with Windows 11 Home, as the ThinkPad E16, the Dell XPS 14 and the HP OmniStudio X do, it reads 99.99 US dollars for the upgrade to Pro. The full 199.99 applies only to a device delivered without any Windows license at all. On the Apple side the line reads zero in every category: macOS comes with every Mac and costs nothing, including at version upgrades.
That Pro is assumed at all, rather than Home, comes down to two features that are practically mandatory in companies: domain join and BitLocker encryption. For Windows 11 Pro, Microsoft charges 199.99 US dollars, or 99.99 to upgrade from Home to Pro.
A flat figure across every Windows category, by contrast, would count the item twice. The Dell Pro Micro, for instance, costs 928.59 US dollars including Windows 11 Pro; the license already sits inside the purchase price, and adding a license line on top would be money nobody spends.
All told, the Windows side carries this item in three of the five computer categories at 99.99 US dollars each; for the two machines that come with Pro preinstalled, the ThinkPad L14 and the Dell Pro Micro, the line reads zero. That is what makes it tightest on the pro laptop, where about 80 US dollars separate the two sides over four years. Companies on volume licensing agreements pay less than the single-unit prices used here anyway.
Software Costs
Workplace software is the biggest lever in the whole calculator, bigger than any hardware difference. That is why not a single category is preselected: the calculator starts as a pure device comparison, and you decide in the software licenses section what gets added. A single ticked row can outweigh the entire price difference between the two devices.
Fourteen categories are on offer, from project management through video editing to accounting, the usual software stack of a business. In three of them the Windows side costs the same or less.
One pattern runs through nearly every row, and it is not the expected one: the same program is not cheaper on a Mac. The difference comes from there being a version to buy on the Mac where Windows leaves only a subscription. Final Cut Pro costs 299.99 US dollars once and then runs without further payment; Adobe Premiere Pro costs 22.99 US dollars a month, so 275.88 US dollars a year, every year. After four years that is 299.99 against 1,103.52 US dollars. The reverse also holds: Premiere Pro, Photoshop, After Effects and Acrobat run on the Mac too, at the same price. Anyone using them does not get this advantage. The row shows the gap between two tools, not a platform discount.
Project Management and Documentation
On the Apple side we use Merlin Project at 229.99 US dollars a year and adoc Studio at 249.99 US dollars a year, both subscriptions per workplace. On the Windows side, project management is covered by Microsoft Planner and Project Plan 3 at 30.00 US dollars per user and month billed annually, so 360.00 US dollars a year. The choice deliberately falls on the subscription rather than the perpetual license: a one-time amount would not be neutral across a slider from one to ten years, because it carries the full purchase sum at one year and looks artificially cheap at ten. An annual figure on both sides stays comparable across the whole range. The subscription therefore sits above the perpetual license spread over three years; anyone buying once should use the lower figure from the section below.
For structured documentation in DITA or XML we use Adobe FrameMaker as a stand-in: 479.88 US dollars per year and seat, read off Adobe's own checkout. Adobe no longer sells a perpetual license, and there has been no macOS version since version 7. This is the item where your figures are most likely to differ: MadCap Flare, a comparable tool, costs 3,150 US dollars a year, and volume licenses come in lower.
Training and onboarding appear in no category. They can arise with almost any of these tools, range from an afternoon to a multi-day course depending on prior knowledge, and an item attached to a single product distorts the comparison. If you know what rollout costs you, enter the amount in the last row.
Between these two pairs sits a third row that shifts the result by exactly nothing: Oxygen XML Editor at 443 US dollars a year, the same amount on both sides. The tool runs as a Java application on macOS and Windows alike, and that is precisely why it is in the calculator: it answers the question of what else exists between adoc Studio and FrameMaker, and it shows a class of tool where the platform makes no difference to the price.
Project management gets a second row in which two one-time purchases face each other and Merlin Project does not appear at all: OmniPlan 4 Pro at 399.99 US dollars against Project Professional 2024 at 1,129.99 US dollars. Professional rather than Standard, because the Apple side of that row is OmniPlan 4 Pro, the full tier as well. Anyone who would rather buy than rent uses that row instead of the first.
The Remaining Categories
The other ten rows cover what else runs on a workplace machine. All amounts are list prices as of August 2026 and appear in the calculator next to each program:
- Office suite: Microsoft 365 Business Standard at 282.00 US dollars a year, the same amount on both sides. Apple's iWork is free but does not replace Word and Excel once documents with formulas, mail merges or comments leave the building.
- UI design: Sketch at 144 US dollars a year against Figma Professional at 192 US dollars a year.
- Video editing: Final Cut Pro at 299.99 US dollars once against Adobe Premiere Pro at 275.88 US dollars a year.
- Music production: Logic Pro at 199.99 US dollars once against Ableton Live 12 Standard at 349 US dollars once.
- Motion graphics: Motion at 49.99 US dollars once against Adobe After Effects at 275.88 US dollars a year.
- Image editing: Pixelmator Pro at 49.99 US dollars once against Adobe Photoshop at 275.88 US dollars a year.
- Document management: DEVONthink Pro at 199 US dollars once against ecoDMS Business at 162 US dollars once.
- CRM: Daylite Growth at 360 US dollars a year against Dynamics 365 Sales Professional at 780 US dollars a year.
- PDF editing: PDF Expert Premium at 79.99 US dollars a year against Adobe Acrobat Pro at 239.88 US dollars a year.
- Invoicing and accounting: GrandTotal L at 108 US dollars a year against Lexware Office L at 340 US dollars a year.
Three of these rows do not come out in Apple's favour, and they stay in for exactly that reason: the office suite costs the same on both platforms, Oxygen XML Editor does too, and in document management ecoDMS Business sits below DEVONthink Pro. A comparison that only lists categories where Apple comes out ahead would be no comparison at all.
Three caveats belong with this. The accounting row reflects the German market, because that class of software is tied to national tax law; a business elsewhere compares different products, and the dollar figures for GrandTotal and Lexware Office are conversions rather than US list prices. For Adobe we use the individual plan: Adobe no longer sells a single app to companies on its own, and a business contract means Creative Cloud Pro at 99.99 US dollars a month, so 1,199.88 US dollars a year for the whole suite. The individual plan may be used commercially and is the figure less favourable to Apple, which is why it is in the calculator. And several vendors set their regional prices independently, Adobe and Ableton most visibly; those rows look different in the German version of this article.
For tablets and smartphones, licenses stay out of the calculation entirely, and the reason lies in licensing itself: workplace software is licensed per person, not per device. Anyone using a tablet alongside their computer does not pay for Merlin Project a second time, and a Plan 3 subscription likewise covers the same user across all their devices. A license row in these two categories would therefore count costs twice. Availability comes on top: Merlin Project and adoc Studio run natively on iPad and iPhone, while Microsoft offers no native Project app for iPadOS or Android, only browser access to Project for the Web; FrameMaker is Windows-only software, and most of the remaining programs exist for neither mobile system.
Unlike the hardware, the figures here are the list prices of the respective region. Software vendors price regionally, so the calculator does not convert these amounts but uses the price of the active currency directly. Where a vendor lists in one currency only, the other figure is converted at the ECB reference rate; that is noted on the rows concerned in the underlying data.
Whatever else applies to you and is not listed here goes into the last row of the list as an annual amount, separately for Apple and Windows. If the same program runs on both sides, such as line-of-business software in the browser, put the same amount left and right; if you use different tools, enter each one's cost. As soon as either field holds an amount, the row switches itself on.
What about the Perpetual License?
Bought outright, Microsoft Project brings no real cost advantage either. Spread across three years, Project Standard 2024 works out at 226.66 US dollars per user and year and Project Professional 2024 at 376.66. Merlin Project costs 229.99 US dollars a year, so Standard lands within a few dollars of it, while Professional runs 146.67 US dollars per user and year higher.
Three years is not an arbitrary span but the rhythm in which Microsoft ships new main versions: 2016, 2019, 2021, 2024. There is no discounted upgrade path, so staying current means buying the new version at full price. The purchase prices themselves are 679.99 US dollars for Standard and 1,129.99 for Professional.
Skipping the repurchase keeps that money and ends a six-year period on a version up to six years old. Merlin Project stays current throughout the same period.
Every Category at a Glance
The calculator only ever shows one category. The overview below puts all seven side by side, with the default assumptions and without software licenses, so the devices stay comparable.
Entry-level laptop
MacBook Neo: US$464 cheaper
Business laptop
MacBook Air 13: US$304 cheaper
Pro laptop
MacBook Pro 14: US$78 cheaper
All-in-one desktop
iMac 24: US$329 cheaper
Compact desktop
Mac mini: US$191 cheaper
Tablet
iPad 11: US$155 cheaper
Smartphone
iPhone 17: US$117 cheaper
Calculator defaults: purchase price, residual value, operating system license, IT support and energy. Software licenses are left out here because they attach to the workplace, not to the device.
What Deliberately Stays out of the Calculation
Four items are deliberately left out: two that would favor Apple and two that count against it. They are missing not because they are unimportant, but because no per-device figure can be documented for them that would survive being checked.
In Apple's favor there are first the three soft factors Forrester measured:
- 5 percent higher productivity
- 20 percent better employee retention
- a 50 percent lower risk of data breaches
That last point in particular can dwarf every amount calculated here in an individual case.
Also in Apple's favor, the period of use itself stays out. We compare both platforms over the same time frame, even though Macs often remain in service longer in practice. To reflect that, mentally set the slider for the Windows device to a shorter period and add the cost of replacing it sooner.
The other two items are left out at Apple's expense. The first is device management. An MDM solution for Macs costs 40 to 60 US dollars per device per year depending on vendor, while Microsoft Intune is already included in many Microsoft 365 plans. We still leave it out, because it is not symmetrical with the operating system license: a Mac runs perfectly well without a management solution, a Windows machine does not run without a license. One is an organisational choice, the other a technical requirement, and they do not belong on the same line. If you do run a management solution, weigh its cost on both sides yourself.
The second is support and warranty contracts such as AppleCare for Business, Dell ProSupport or Lenovo Premier Support. The calculator covers internal IT effort through ticket volume and cost per ticket; external contracts sit on top of that and depend so heavily on contract terms, duration and fleet size that a flat per-device figure would imply more precision than it has.
Conclusion
Over a typical period of four years, the Apple devices come out ahead in all seven categories, from the entry-level laptop to the smartphone, by roughly 80 to 465 US dollars without software licenses. That holds for the default assumptions. Switch the calculator to Conservative, dropping the residual value and letting both sides raise the same number of tickets, and Apple is still ahead in six of the seven categories. Looking only at the purchase price therefore means underestimating the follow-up costs.
In five of the seven categories the Apple device is even cheaper to buy, and on the all-in-one desktop both sides are level. Only on the pro laptop does Windows start cheaper: the Dell XPS 14 begins about 300 US dollars below the MacBook Pro 14, and that is also where the narrowest final gap of about 80 US dollars remains. On the mini desktop the M6 has cut the Mac mini's head start at purchase to 30 US dollars, and it still ends four years about 190 US dollars ahead. In every other category, residual value, support and energy pull the difference clear over the period of use. In the end, your own numbers decide: enter your device prices and see how the math works out for you.
If you have any questions about this blog article or would like to discuss it, we look forward to your contribution in our forum.
Frequently asked questions
Is a Mac more expensive than a Windows PC?
Usually not, neither on the purchase price nor over the full period of use. In five of the calculator's seven categories the Apple device already starts cheaper; only on the pro laptop does the Windows machine lead on purchase price. Over four years, a MacBook Air 13 comes out about 300 US dollars below a comparable ThinkPad, software licenses excluded. Residual value, support effort and energy use widen that gap further.
What belongs in the total cost of ownership of a computer?
Purchase price, residual value at resale, operating system license, IT support cost, energy consumption and software licenses. Residual value lowers the total more than most calculations assume: for a Mac it still accounts for roughly a quarter of the original price after three years. Device management and external support contracts are not included, because both apply on either platform and depend heavily on contract terms.
Why do Macs generate fewer support tickets?
IBM manages more than 200,000 Apple devices and reports that PC users raise twice as many support requests. The reason is the narrow range of hardware and drivers, because Apple develops chip, device and operating system together. Only 5 percent of Mac cases needed an on-site visit, against 27 percent on Windows.
What is a Mac worth after three years?
The Forrester study on Mac in the enterprise reports 25 percent of the original price after three years. The calculator uses 22 to 28 percent for Macs and 13 to 17 percent for Windows devices, depending on category. The market matters: consumer resale figures run considerably higher, but what counts for a company is what commercial buyers pay. For smartphones it is 40 against 28 percent.
From what period of use does a Mac pay off?
The effect depends less on fleet size than on how long devices stay in service. Below two years the purchase price dominates; from three to four years residual value and support savings take over. The longer a device is used, the more the lower running costs matter.