Glossary
Gantt

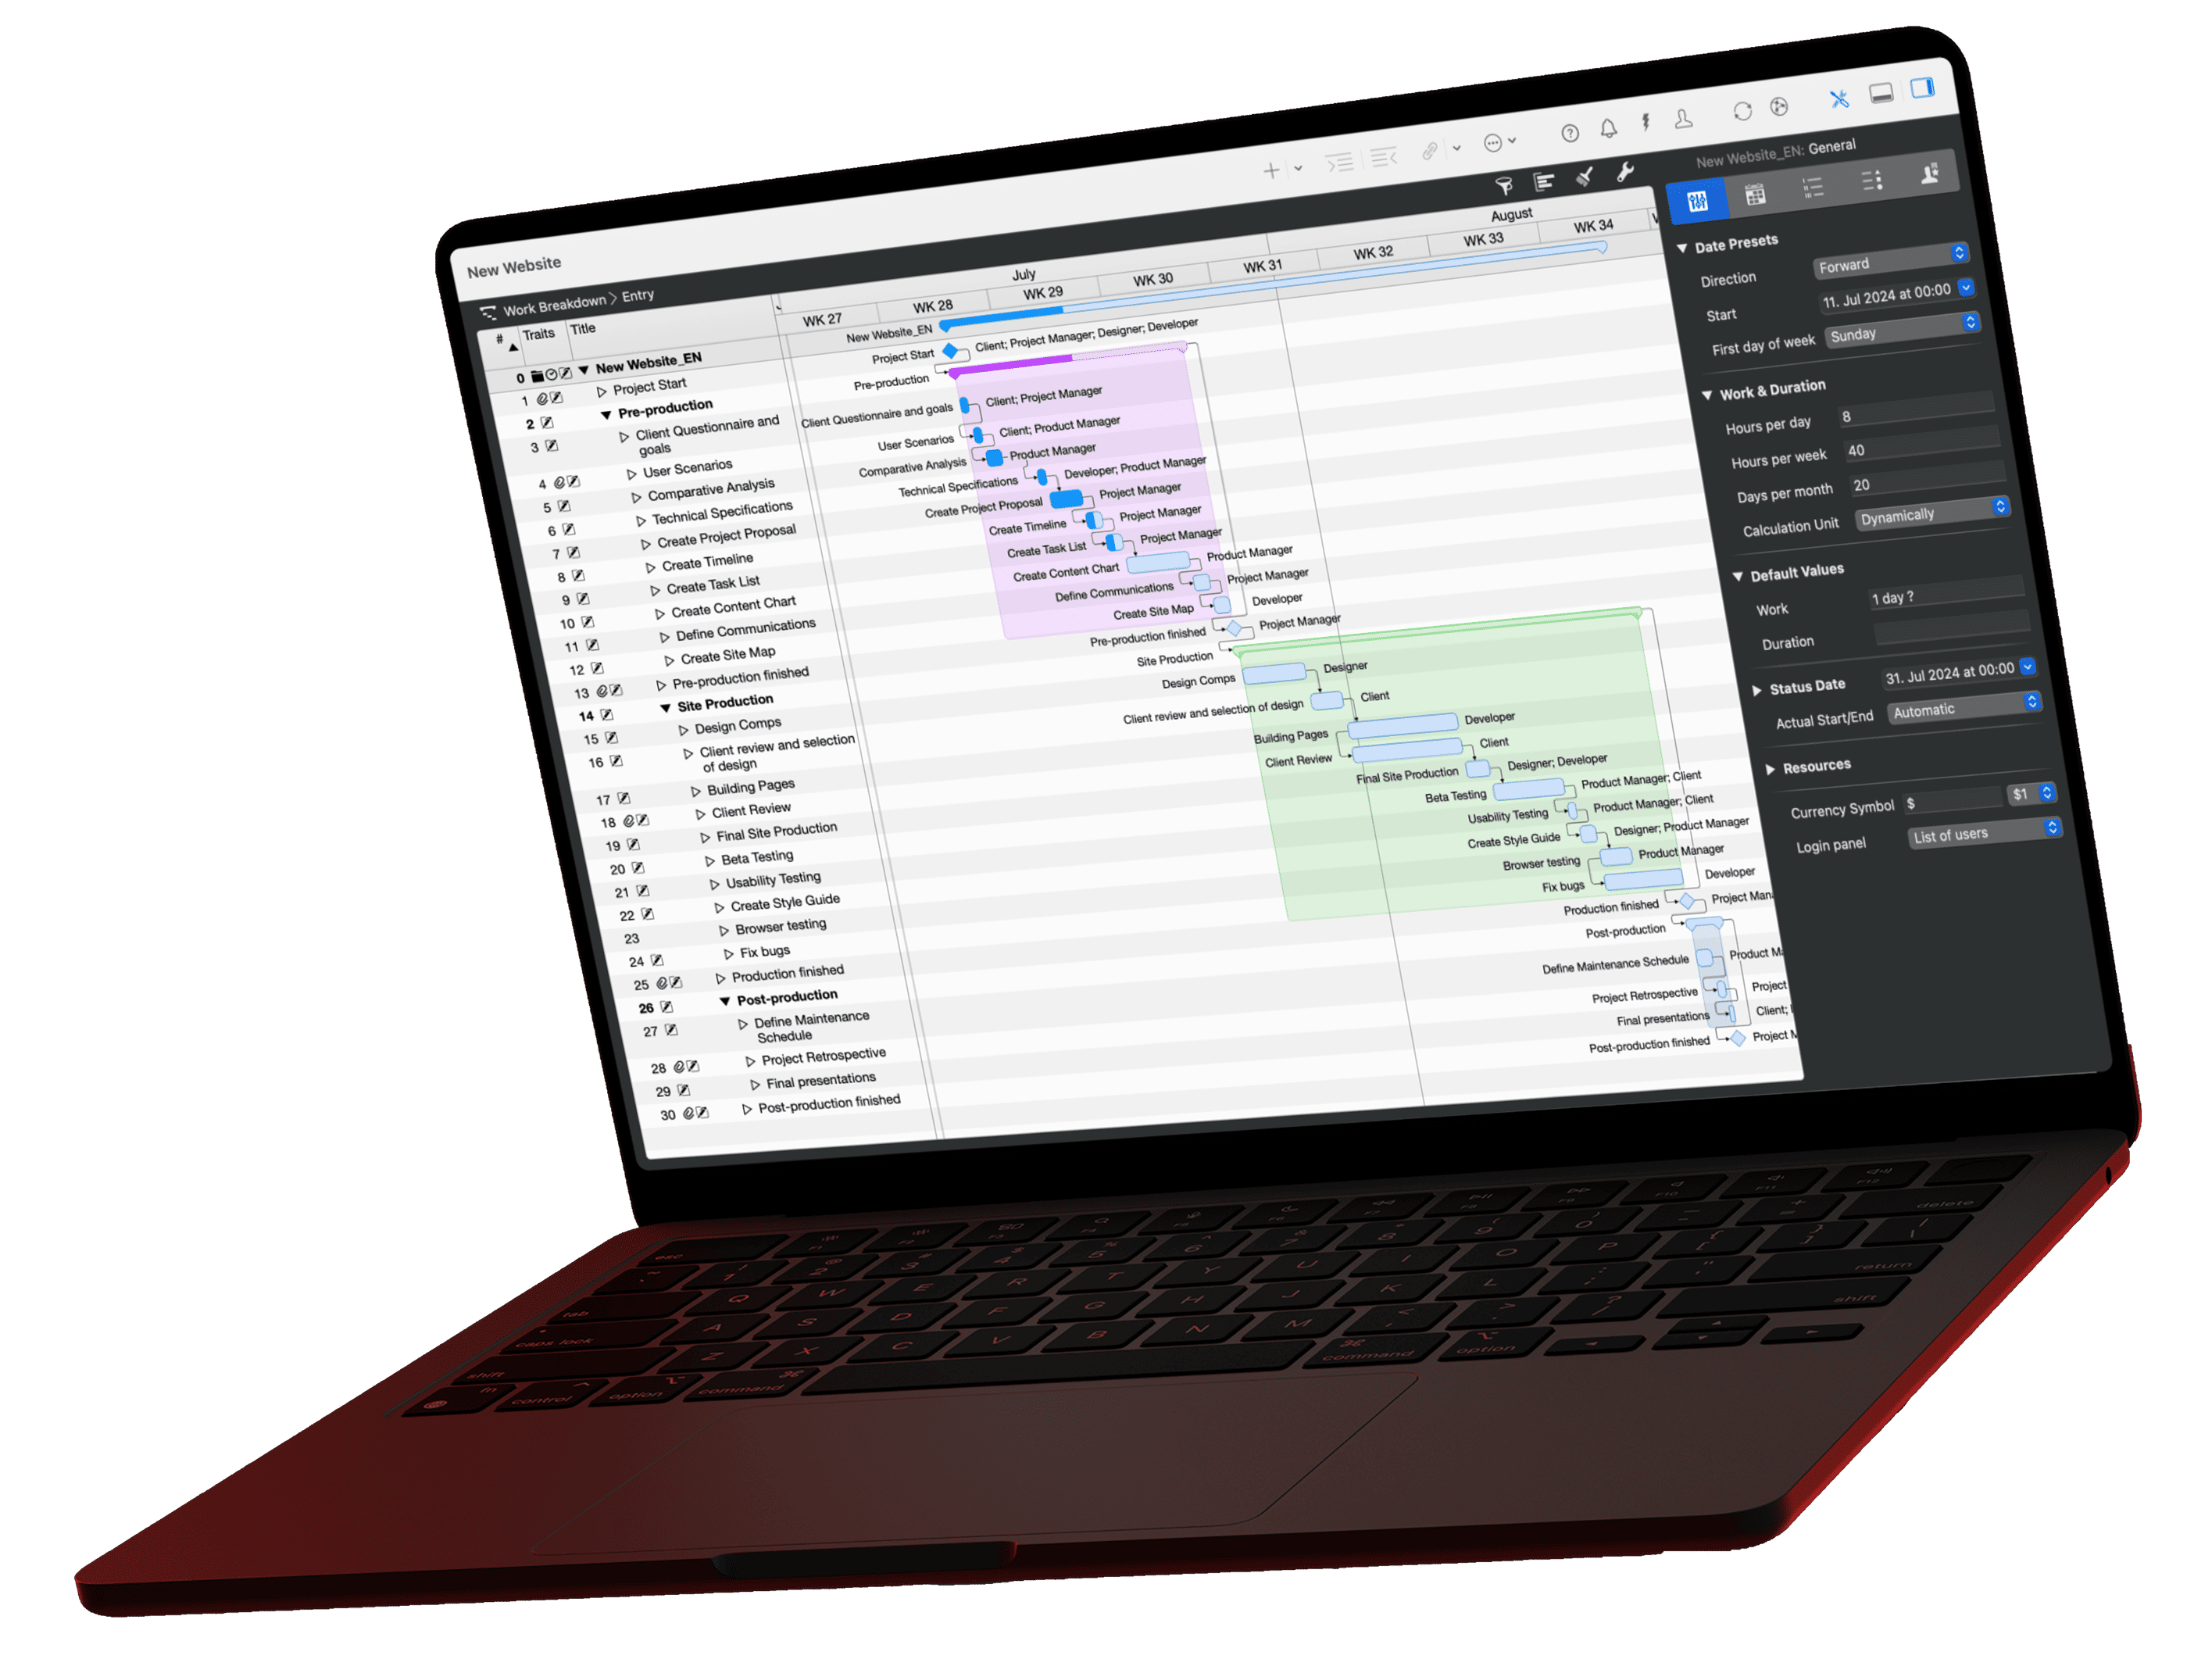
A Gantt chart, also called a bar chart or project timeline, shows a project's activities as bars on a timeline. The length of a bar is the duration, arrows show dependencies, and diamonds mark milestones. It is named after Henry L. Gantt, who popularized it between 1910 and 1915.
In Merlin Project, the Gantt chart sits in the Work Breakdown view to the right of the activity list, for example in the project views "Entry" and "Plan/Actual Comparison (Time)". View > Show Critical Path highlights the activities without slack in red.
Gantt Chart in Project Management: How to Make One, With Example
The guide uses a trade show project with 7 activities and 2 milestones to show how to read a Gantt chart, build one in seven steps and create it in Merlin Project.
 Read the guide