Activity view is focused on displaying the schedule from the context of an activity since it is used as the main building block of that view. Utilization view displays the same project but from the resources context.
Utilization view lists all the activities grouped per resource. The Gantt chart is replaced with utilization blocks that represent resources allocation.
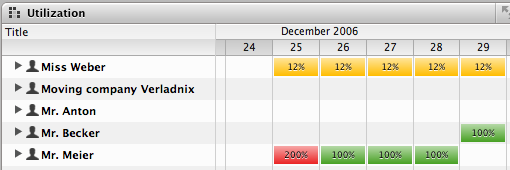
The colors of the boxes follow these rules:
- Red: The resource is over utilized (over-allocated)
- Yellow:The resource is not over utilized (not over-allocated)
- Green: The resource is ideally utilized (fully allocated)
By default, over allocation is defined above 100% and a under utilization below 25%. However, you can define it in the resource leveling settings.
If you select the button "Enlarge the cumulation" ![]() in the functional toolbar, the selected rows will be expanded. This switches the display to show you a histogram of the resource utilization in detail, based on the time scale. You can also expand or contract the rows by grabbing the bottom of the row with the mouse and dragging it to the desired size. If you press the Option (⌥) key while doing this, all the rows in the view will be expanded.
in the functional toolbar, the selected rows will be expanded. This switches the display to show you a histogram of the resource utilization in detail, based on the time scale. You can also expand or contract the rows by grabbing the bottom of the row with the mouse and dragging it to the desired size. If you press the Option (⌥) key while doing this, all the rows in the view will be expanded.

By clicking on the triangle in front of the resource name, Merlin displays all the assignments for the respective resource. This is important: The resource assignments are displayed and not the activities
As in all Merlin views with many combined or multiple projects, there is a special function in the Utilization view: When common resources are inserted in the combined projects, these "Master Resources" automatically change and show all assignments of the contained projects.
Manual Leveling
When assignments are visible, their respective bars in the graphical view can be moved to the right or left with the mouse so you can manually level your resources.
